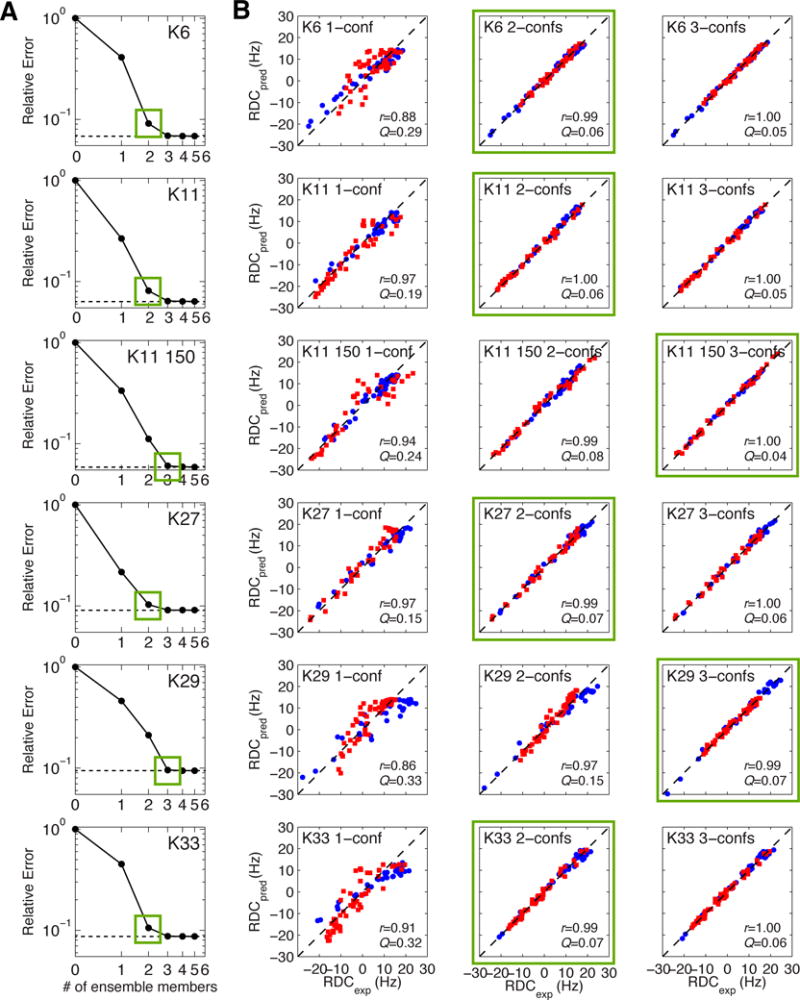
Figure 7.

(A) l-curve analysis to determine the optimal number of conformers (indicated by green squares) for protein ensemble solutions. The dashed line represents the relative error for the best possible ensemble solution of size > 0. (B) Agreement between experimental RDCs for both Ubs taken together vs. RDCs predicted from 1-conformer, 2-conformer, and 3-conformer ensembles. Data for the distal and proximal Ubs are colored blue and red, respectively. Pearson’s correlation coefficient (r) and quality factor (Q) values are indicated inside each plot. Similar analysis for K63-Ub2 is shown in Figure S7.
