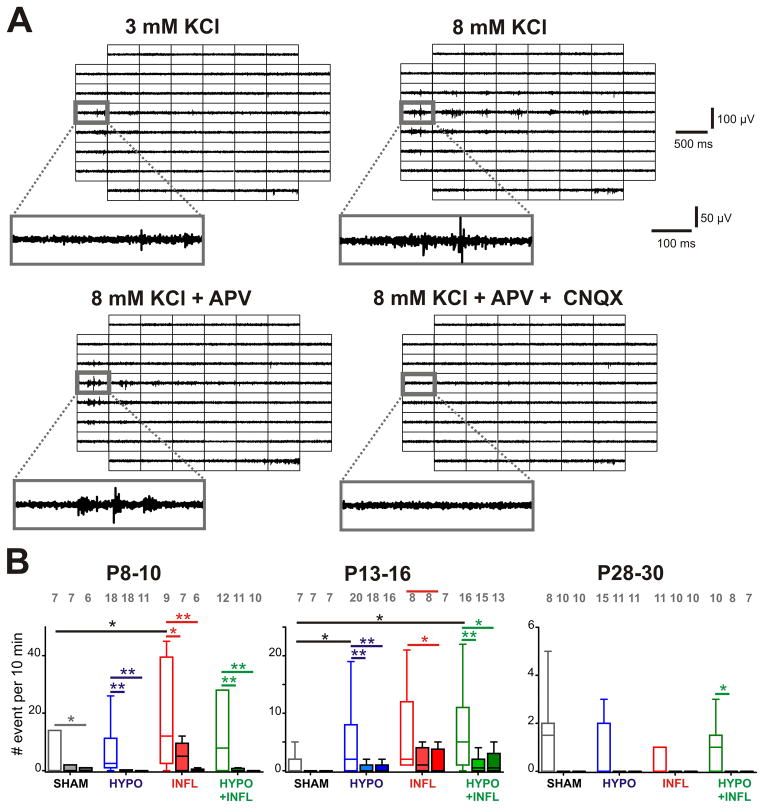
Figure 3. Pharmacological properties of epileptiform events induced by hypoxia and inflammation.
A) Examples of EEs recorded from a slice prepared from a P13–16 HYPO animal with different recording conditions. For each of the recording solutions indicated, 500 ms recording traces show the activity recorded by each of the 60 electrodes of the MEA during a spontaneously occurring EE. The recording trace on the electrode marked by a grey square is magnified below. APV decreases the number of events compared to 8 mM KCl-ACSF alone while addition of CNQX suppresses it. B) The mean frequencies of EEs occurrence in a ten minute recording period per slice and per condition is plotted as box and whisker plots (SHAM, dark grey; HYPO, blue; INFL, red; HYPO+INFL, green). For each age group, the mean number of occurrence is plotted for 8 mM KCl ACSF (open boxes), APV alone (light filled boxes) or APV and CNQX together (dark filled boxes). Dunns test: **, p<0.01; *, p<0.05.

