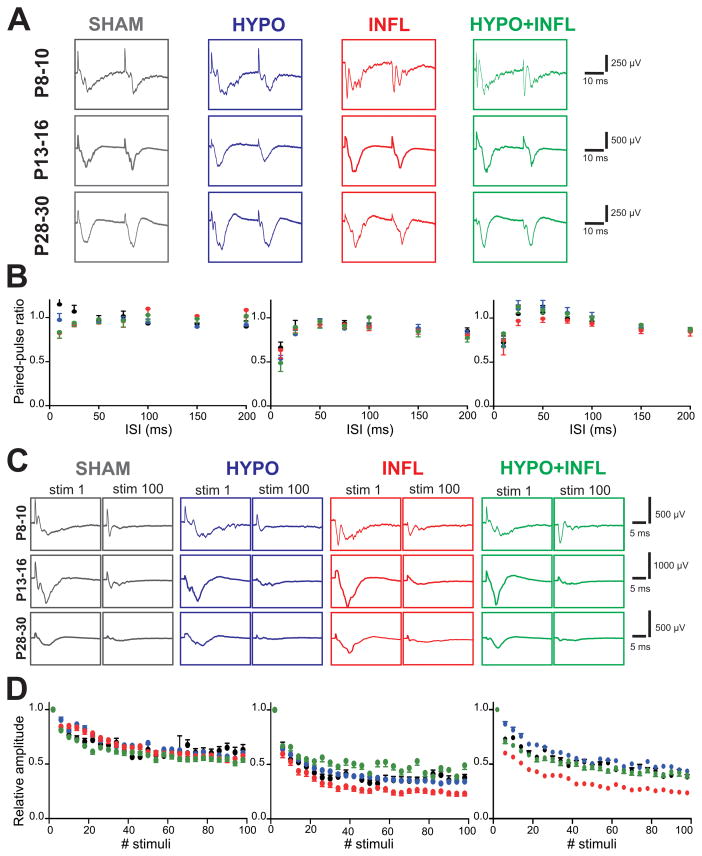
Figure 6. Synaptic activity between L4 and L2/3 is not altered by hypoxia and/or systemic inflammation.
A) Example traces of the evoked responses in L2/3 to paired-pulse stimulation in L4 (2 V) with 25 ms between both stimuli for each age and treatment condition (SHAM, dark grey; HYPO, blue; INFL, red; HYPO+INFL, green) recorded in ACSF with 3 mM KCl. B) Paired-pulse facilitation measured for each treatment condition in P13–16 mice in ACSF with 3 mM KCl. The graphs represent the average PPR obtained from all slices of the different ages and treatments at varying interstimulus intervals. C) Example traces of the first and last evoked responses in L2/3 to 100 pulses at 10 Hz in L4, recorded in ACSF with 8 mM KCl. D) Synaptic fatigue recorded for 100 stimuli at 10 Hz (2 V, 8 mM KCl-ACSF). The graphs represent the relative amplitude of the evoked responses in slices prepared from all treated animals relative to the response to the first stimulus.

