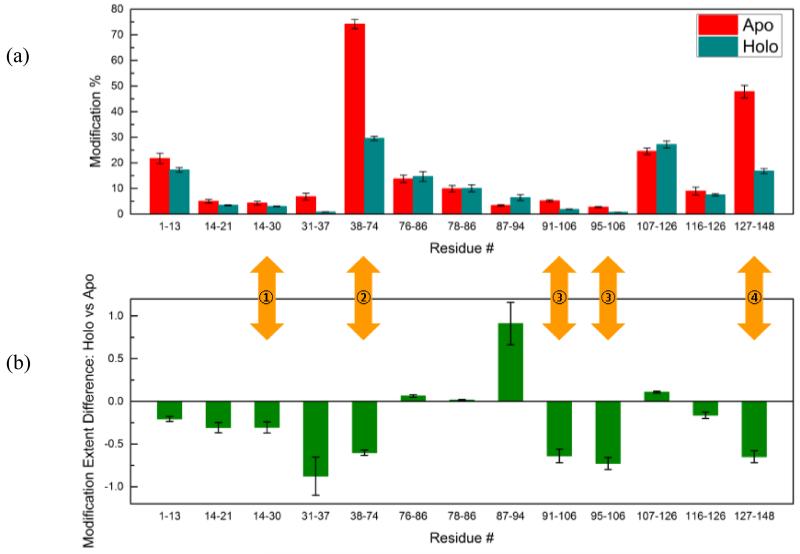
Figure 3.
(a) Comparison of modification extent of peptides from apo and holo CaM. Calcium binding sites are marked by yellow arrows. On the crystal structure of holo Cam (PDB: 1CLL), two calcium binding domains are connected by an ɑ-helix from F65 to V91. (b) A comparison between apo and holo states calculated from ion intensities [(holo - apo)/apo].

