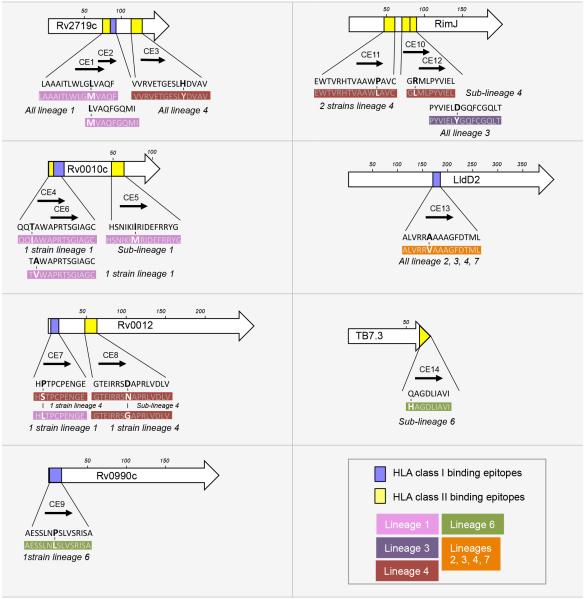
Figure 4.
Localization of the peptides representing candidate variable CD4 and CD8 T cell epitopes predicted using HLA molecules prevalent in the Gambian population. For each protein, a length scale in amino acids is shown. The rectangles depict the positions of the candidate CD4 (yellow) and CD8 (blue) T cell epitopes within the protein sequences. Each epitope is also represented by an arrow and associated with a candidate epitope number (from CE1 to CE14). The amino acid sequences in black are the sequences of the candidate epitopes in the inferred most recent common ancestor of the MTBC. The sequences in white font represent the naturally-occurring variants identified in this work; the amino acid changes compared with the ancestral sequence are in bold. Each variant sequence is color-coded indicated according to its distribution in the MTBC phylogeny. The phylogenetic lineages and the number of strains containing the variant version of each epitope sequence are also indicated. See also Table S2, S3 and S5.

