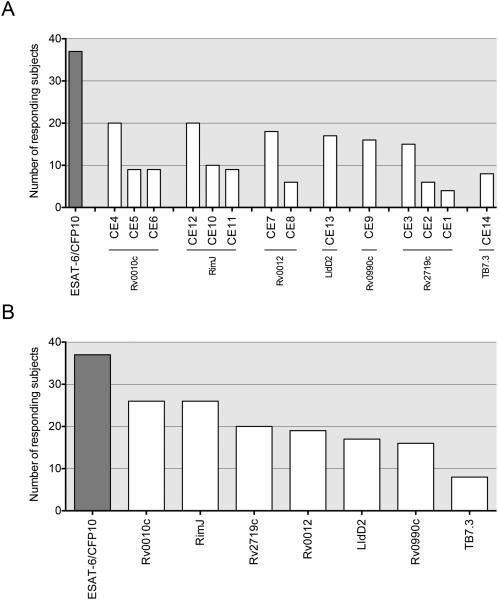
Figure 5.
Frequency of immune responses to the candidate T cell epitopes selected in this work. The results were derived from the diluted whole blood assay using cells from 82 human subjects with active TB, stimulated with synthetic epitope peptides, followed by quantitation of secreted IFN-γ. Number of subjects (of 82 total) responding to (A) the ancestral or variant sequences of each candidate epitope or (B) to all peptides derived from each antigenic protein. Responses were defined as a stimulation index >2, as defined in Methods. Each bar represents the cumulative responses to the ancestral and variant sequences of each candidate epitope. See also Table S7.

