Figure 1. NuMA localizes to microtubule tips.
(A) Diagram of NuMA showing interaction domains for dynein/dynactin, 4.1 family proteins, LGN, and MTs as well as the nuclear localization sequence (NLS). (B–F) Visualization of GFP-tagged NuMA constructs (as diagrammed) and α-tubulin (red) in cultured mouse keratinocytes. All cells displayed expressed GFP constructs at low levels. (B’ and C’) are zoomed-in views displaying the punctate localization of these constructs along MTs and MT tips. (G–G’’) Co-localization of GFP-NuMA-TIP with MT ends (arrows) at the periphery of a cultured keratinocyte. Arrowheads indicate MT tips that lack NuMA-TIP label (scale bar, 5 μm). (H) Keratinocytes were transfected with GFP-NuMA-TIP and then fixed and stained for Eb1 (red). Note the lack of co-localization between NuMA-TIP and Eb1 puncta. (I) Keratinocytes were treated with 10 μM nocodazole for 15 min and then fixed before visualizing GFP-NuMA-TIP and MTs (red). Images on right show a higher magnification view of NuMA-TIP localizing to both ends of shortened MTs. (J) Quantitation of the percent of cells showing GFP-NuMA-TIP localization to MT tips following drug treatments (only low-expressing cells were analyzed). Keratinocytes were treated with either DMSO, 2 nM vinblastine, or 10 μM taxol (n>100 cells each, p<0.05 for each treatment relative to control). (K–K’’) Three-color staining for Eb1 (red), GFP-NuMA-TIP (green) and MTs (blue) in either untreated keratinocytes (top 2 panel rows) or nocodazole treated keratinocytes (bottom panels). Scale bar is 0.5 μm. Unless noted, all scale bars are 10 μm. MT, microtubule.

Figure 1—figure supplement 1. Localization of NuMA fragments when highly expressed.
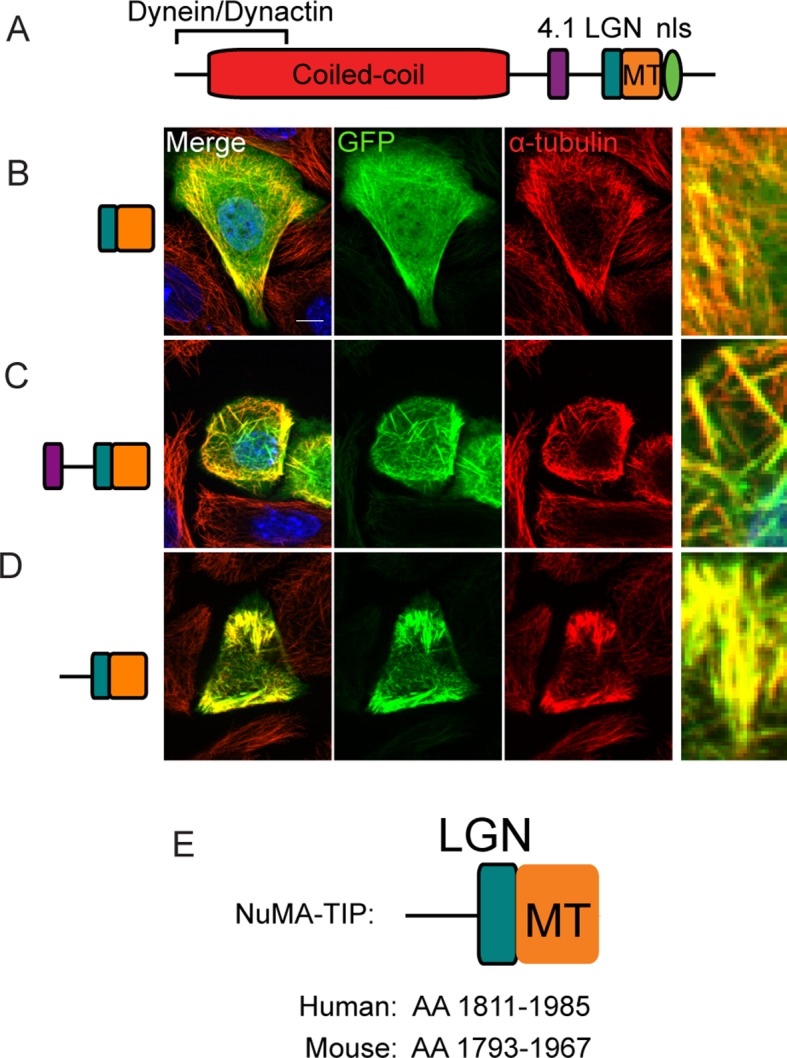
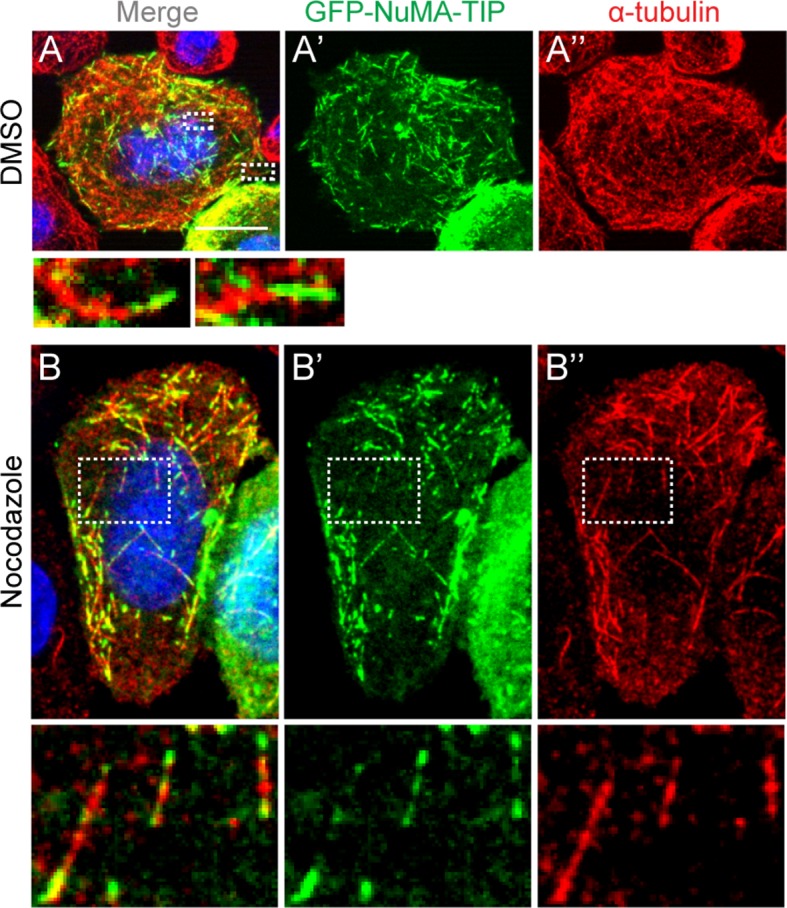
Figure 1—figure supplement 2. HeLa cells transfected with GFP-NuMA-TIP were then treated with either DMSO (A) or 10 μM nocodazole (B), fixed and stained with anti-α-tubulin antibodies (red).