Figure 6. NuMA’s MTBD is required in hair follicle matrix cells for proper spindle orientation, differentiation, and hair generation.
(A) Diagram illustrating the mouse mating used to generate conditional inducible deletion of NuMA’s MTBD in the adult interfollicular epidermis and hair follicles. (B) Diagram illustrating the experimental time course. Mice were injected twice with tamoxifen in telogen of the hair cycle, shaved and then examined for subsequent hair growth in the following anagen. (C) Images of control and NuMAΔMTBD mice treated as described in (B) and photographed at postnatal day 44. (D) Expression of keratin 14 promoter-driven NuMA-GFP in both the interfollicular epidermis and outer root sheath (ORS) of a P2 hair follicle. The hair shaft signal in the top images is due to autofluorescence. The dashed line indicates the basement membrane that separates the dermal papilla and the matrix cells. Note the lack of NuMA-GFP expression in the matrix cells (arrows). (E,F) Photographs of control and matrixΔMTBD mice (K14-Cre; NuMA MTBDfl/fl;K14-NuMA-GFP) at postnatal day 7 (E) and 18 (F). Note that the small patch of dorsal hair is likely due to incomplete recombination and is lost in subsequent hair cycles (Figure 6—figure supplement 4). (G,H) Radial histograms of spindle angles in the matrix cells of control (G) and matrixΔMTBD (H) mice at P2 (n = 40 cells. p = 0.005). (I–T) Immunofluorescence analysis of the indicated hair differentiation markers (green) in control and matrixΔMTBD backskin at P4. Keratin 5/14 labels the ORS, keratin 6 labels the companion layer, P-cadherin labels matrix cells, AE13 labels the cuticle and cortex of the hair shaft, and GATA3 labels the inner root sheath. All scale bars are 20 μm.

Figure 6—figure supplement 1. MatrixΔMTBD mice (4 months old) showing loss of all hair as the animals age.
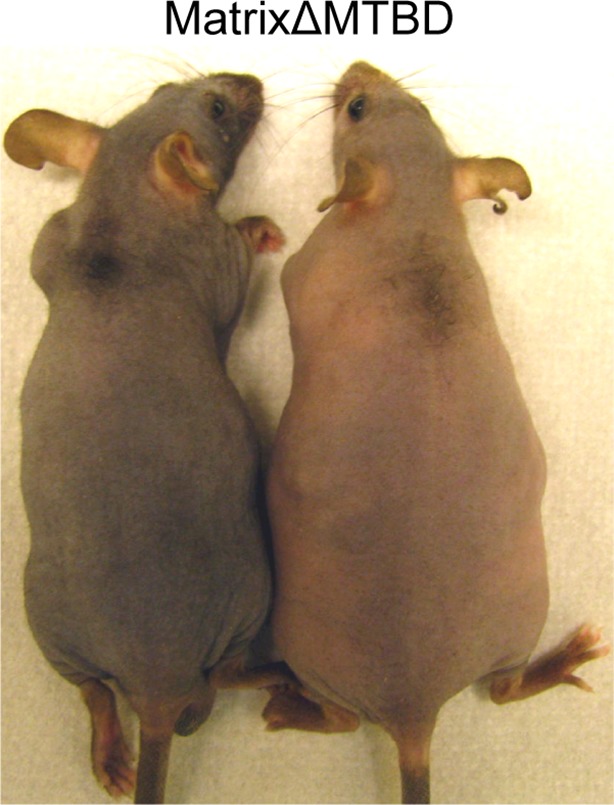
Figure 6—figure supplement 2. Representative images of anaphase spindles in the matrix of the hair follicle.
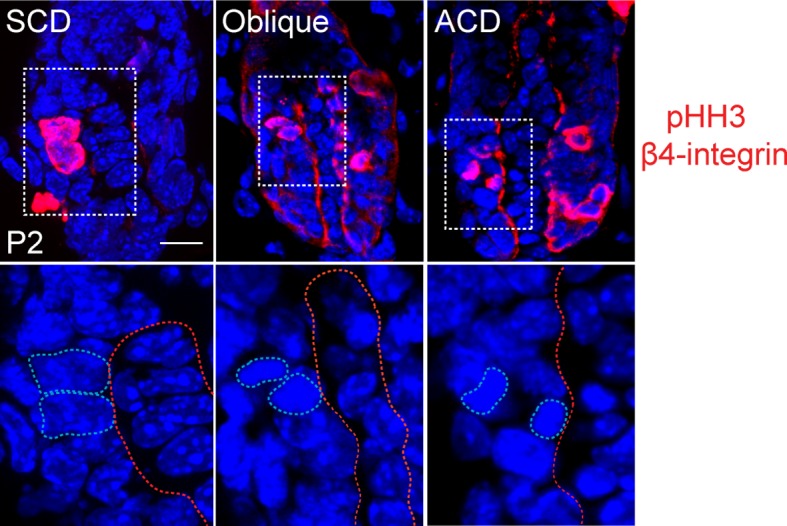
Figure 6—figure supplement 3. Hair follicle histology at P18 (A,B) and P30 (C,D) in control and MatrixΔMTBD mice.
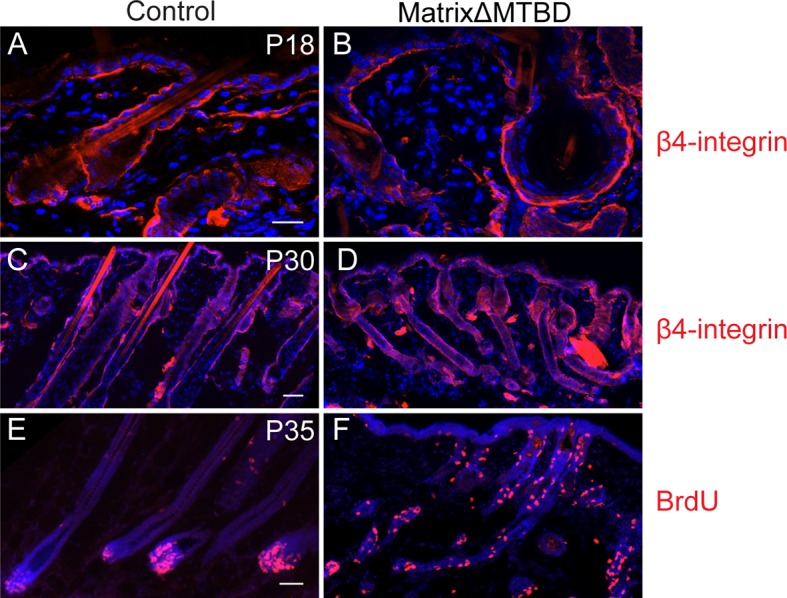
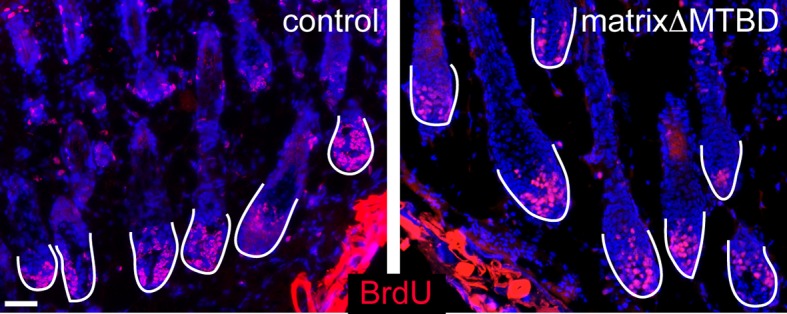
Figure 6—figure supplement 4. Analysis of BrdU positive cells in control and matrixΔMTBD mice at postnatal day 2.