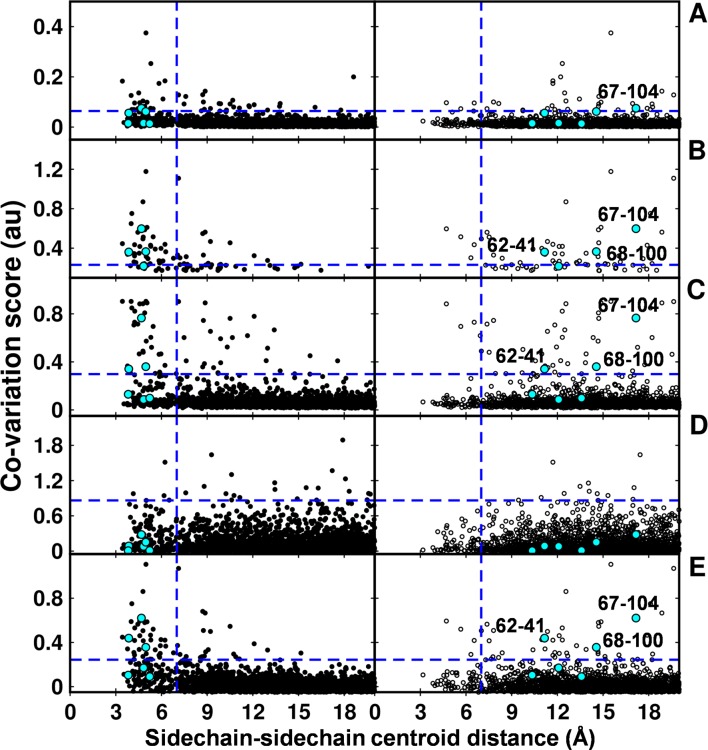
Figure 7. Computational analyses of co-varying residues for DgkA and comparison with experimentally determined contact residue pairs.
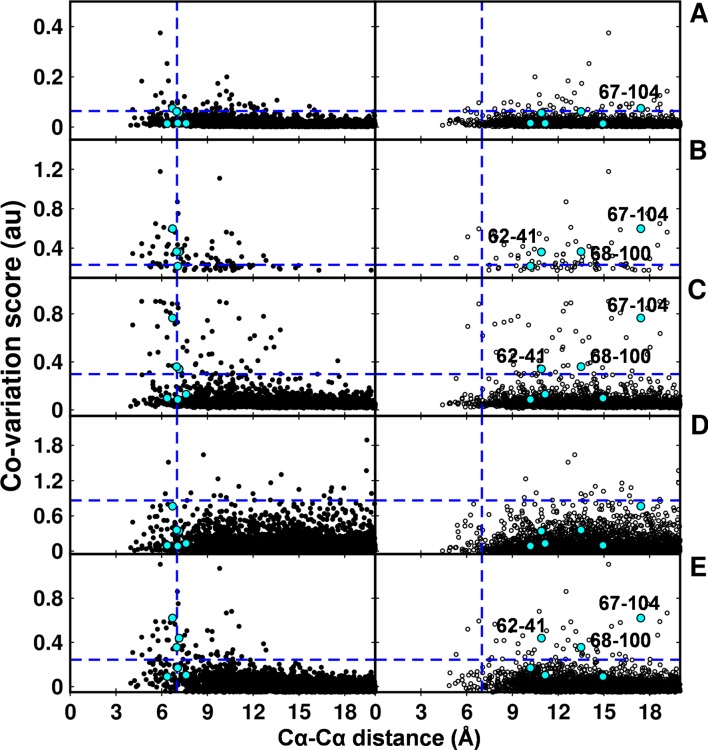
Co-variation analyses using (A) DCA, (B) GREMLIN, (C) PSICOV, (D) SCA and (E) EVfold are shown. Residue pair side-chain centroid distances calculated from DgkA crystal (PDB id 3ZE5) and the NMR 1st pose structure (PDB id 2KDC) are shown in left (filled circles) and right (open circles) panels respectively. 'au' denotes arbitrary units. Blue lines parallel to the X-axis indicate the co-variation score of the L/2th residue pair (when arranged in descending order of the score), where L is the length of the protein (L=121 for DgkA). Blue lines parallel to the Y-axis indicate a sidechain–sidechain centroid distance of 7 Å between the predicted co-varying residue pairs in the corresponding structure. Experimentally determined spatially proximal (Parent inactive mutant, suppressor) contact pairs are shown in cyan. Although several computationally predicted contact pairs in the top L/2 predictions (top panel) are proximal to each other in the crystal structure, there are several predicted pairs which are far apart. Computational analyses of co-varying residues for DgkA and comparison with experimentally determined contact residue pairs using Cα-Cα distances instead of sidechain-sidechain centroid distances are shown in Figure 7—figure supplement 1.


