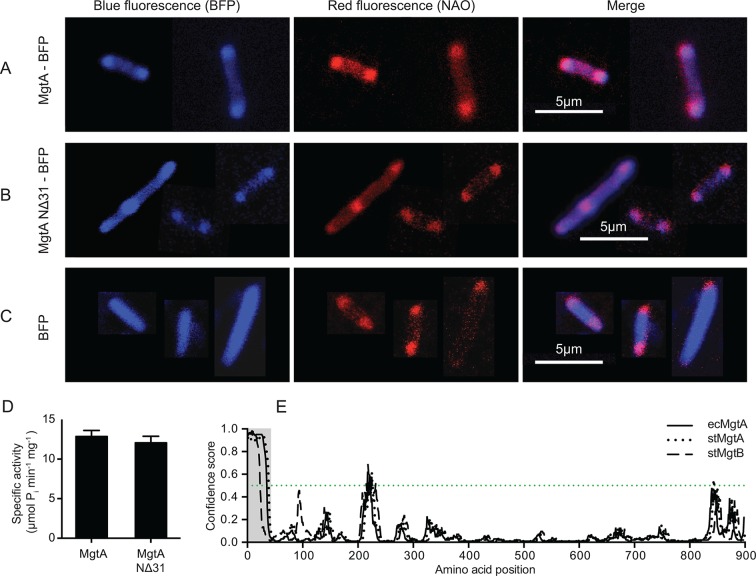
Figure 3. Colocalization of MgtA and CL. in E. coli C43(DE3).
(A) Colocalization of MgtA–BFP with CL. (B) Colocalization of MgtA-NΔ31–BFP with CL. (C) BFP and NAO stained CL. (D) ATPase activity of MgtA and MgtA NΔ31 measured in the presence of 125 μM CL. No significant difference in the ATPase activity was observed. (E) Disordered regions predicted using DISOPRED3 (Jones and Cozzetto, 2015). The polypeptide chain is considered disordered when the prediction is above a confidence score of 0.5. Residues 1–35, marked in grey box shows the disordered region. D, Values plotted are mean ± SD (n = 3).
DOI: http://dx.doi.org/10.7554/eLife.11407.013


