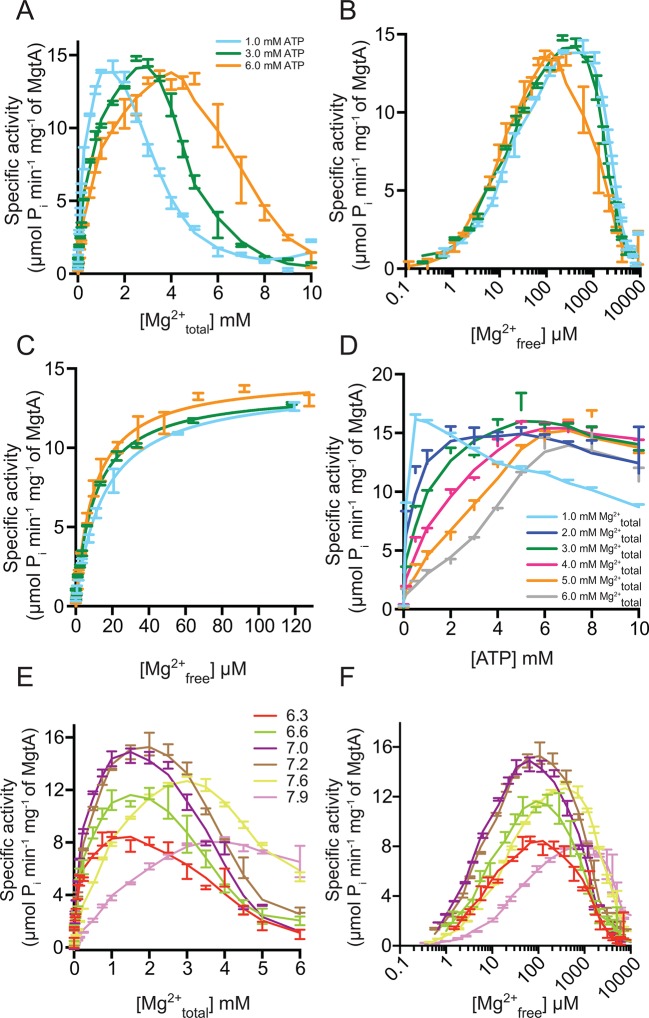
Figure 4. Mg2+and pH dependency of MgtA.
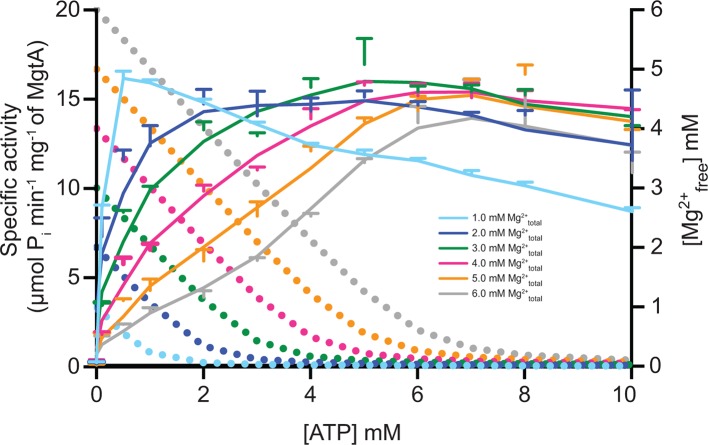
(A) ATP hydrolysis was measured with increasing concentration Mg2+ at fixed ATP concentrations. Irrespective of the ATP concentration used, maximum ATPase activity was observed at around 13 μM Pi min-1 mg-1 and increasing Mg2+ concentration decreases the ATPase activity. (B) Data from [A] was plotted against Mg2+free in assay condition determined using MAXC as mentioned in the methods section. (C) Data from [B] was plotted in the range from 0 to 120 μM Mg2+free and used for kinetic calculations summarized in Table 1. (D) ATP hydrolysis was measured with increasing ATP concentration at various fixed Mg2+ concentrations. Since ATP acts as Mg2+ chelator, the Mg2+free concentration decreases with increasing ATP concentration. (E) ATP hydrolysis measured at various fixed pH conditions while increasing the Mg2+ concentration. Bis-tris propane at indicated pH values was used as buffer. (F) Data from [E] was plotted against calculated Mg2+free. A-F, Values plotted are mean ± SD (n = 3).
DOI: http://dx.doi.org/10.7554/eLife.11407.016


