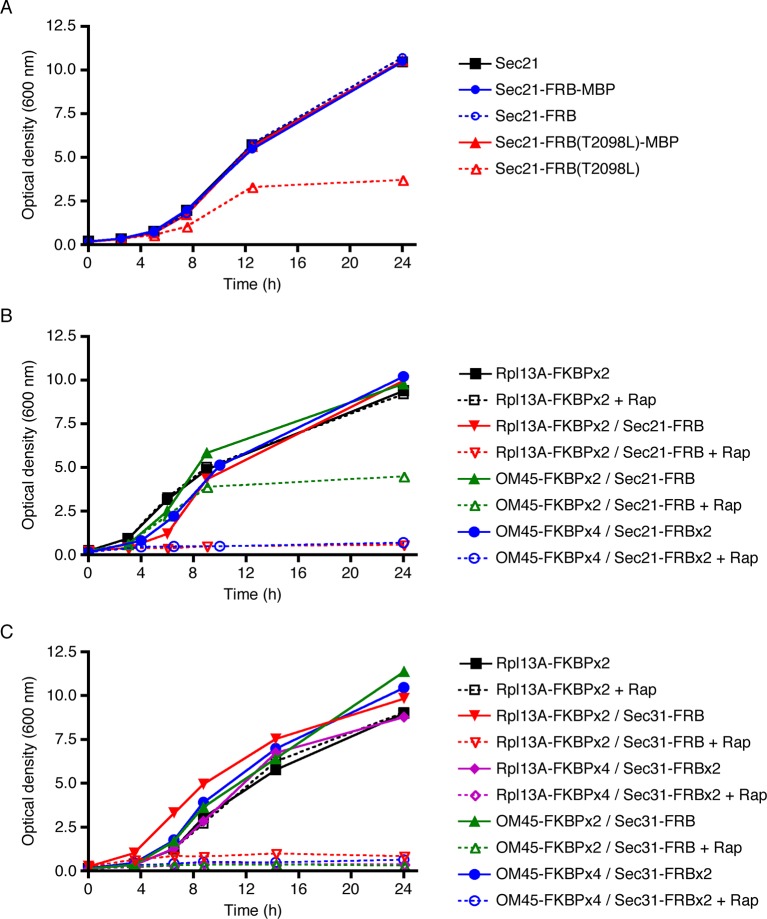
Figure 2. Evaluation of tag-anchor combinations by growth curve analysis. .
TOR1-1 fpr1△ strains were grown with shaking in YPD medium at 30°C to mid-log phase, then diluted in fresh medium to an optical density at 600 nm (OD600) of 0.15. Where indicated, rapamycin (“Rap”) was then added to 1 μg/mL. After further incubation at 30°C, aliquots were taken at the indicated time points to measure the OD600. (A) The function of Sec21 is preserved after tagging with wild-type FRB but is compromised after tagging with mutant FRB(T2098L). Gene replacement was used to extend Sec21 at the C-terminus with either wild-type FRB, or FRB(T2098L), or an FRB-MBP dual tag, or an FRB(T2098L)-MBP dual tag. A control strain expressed wild-type Sec21. (B) COPI can be inactivated by extending Sec21 with a single FRB tag followed by anchoring to ribosomes using the Rpl13A-FKBPx2 anchor, or by extending Sec21 with a double FRB tag followed by anchoring to mitochondria using the OM45-FKBPx4 anchor. (C) COPII can be inactivated by extending Sec31 with a single or double FRB tag followed by anchoring to either ribosomes or mitochondria.
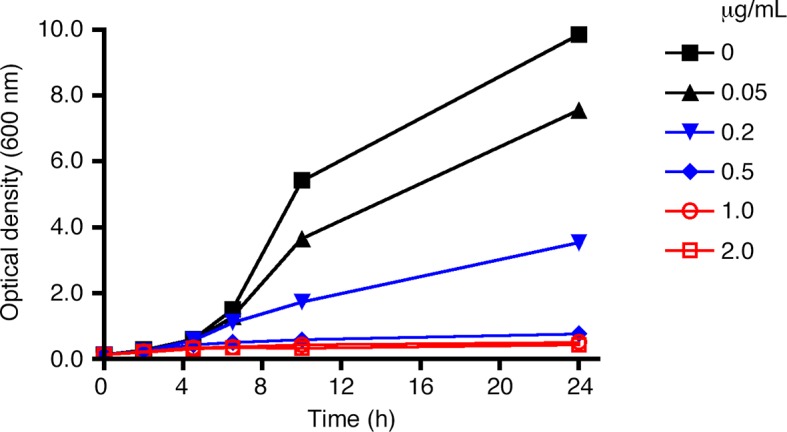
Figure 2—figure supplement 1. Effect of rapamycin concentration on anchor- mediated growth inhibition.

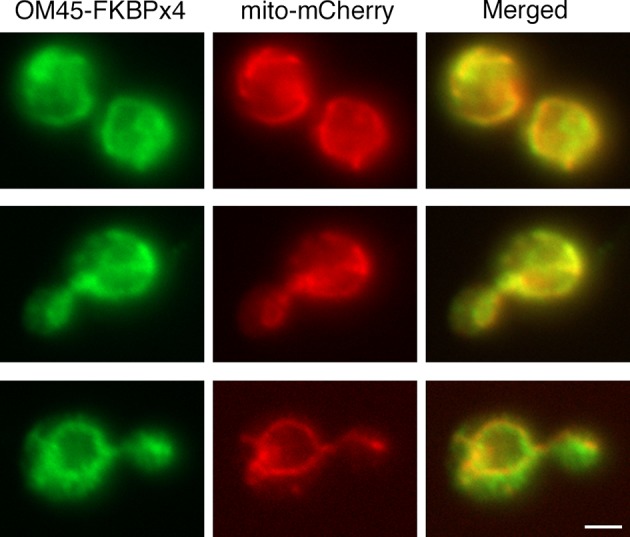
Figure 2—figure supplement 2. Localization of FKBP-tagged OM45 to mitochondria.


