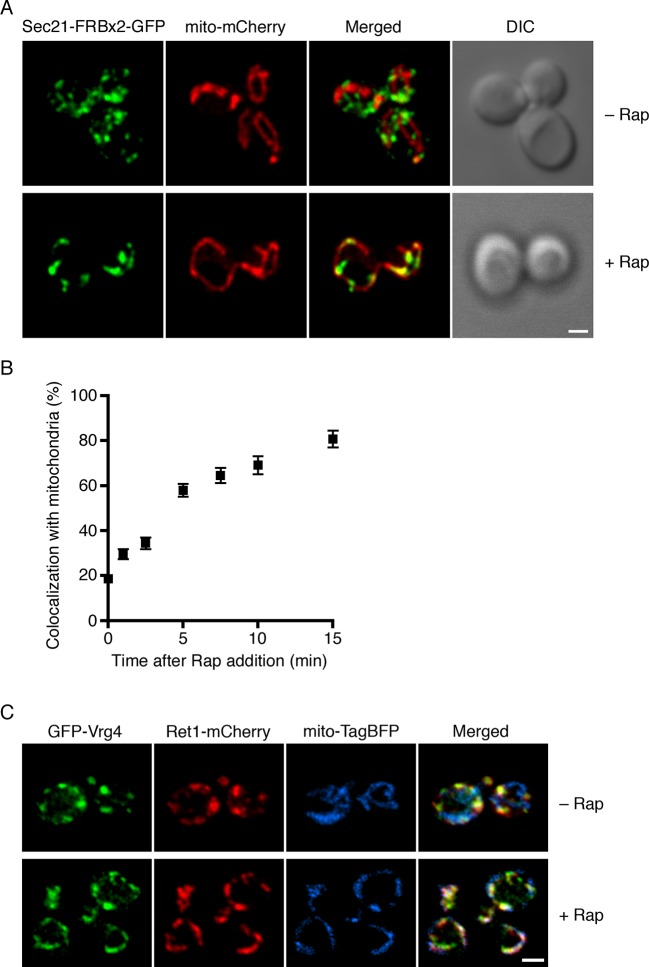
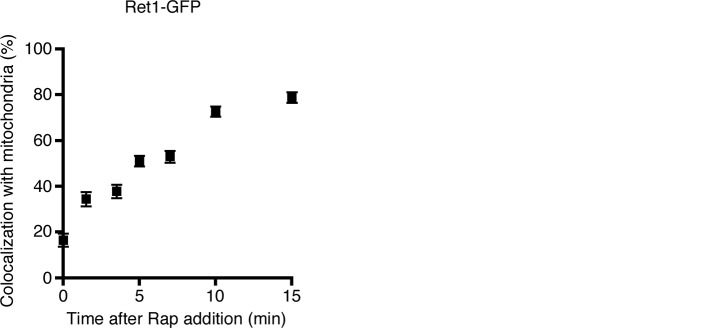
Figure 3. Visualization of COPI anchoring to mitochondria.
(A) Sec21 tagged with FRBx2-GFP can be anchored to mitochondria containing OM45-FKBPx4. The mitochondrial matrix was labeled with mCherry. Representative cells are shown before drug treatment, and after treatment for 10 min at 23°C with 1 μg/mL rapamycin (“Rap”). Cells were imaged by confocal microscopy followed by deconvolution. Scale bar, 2 µm. (B) Maximal anchoring to mitochondria occurs within 10–15 min. Anchoring of Sec21-FRBx2-GFP was quantified by measuring the fraction of the GFP signal that colocalized with the mCherry signal (Levi et al., 2010) at different times after rapamycin addition at 23°C. Approximately 20–30 cells were analyzed at each time point. Error bars show s.e.m. (C) Anchoring COPI also anchors early Golgi cisternae. Sec21 was tagged with FRBx2 in a strain with the OM45-FKBPx4 mitochondrial anchor. The strain also expressed GFP-Vrg4 to label early Golgi cisternae, Ret1-mCherry to label COPI, and mito-TagBFP to label the mitochondrial matrix. Cells were imaged before or after rapamycin addition as in (A).


