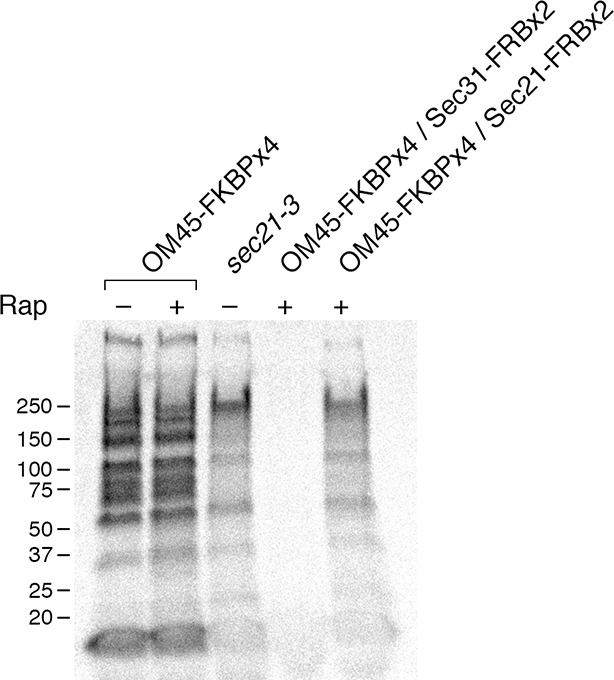
Figure 6. Comparison of methods for inactivating Sec21.
General secretion was visualized by a pulse-chase analysis as in Figure 5A, except that cells were grown at 23°C and then shifted to 37°C for 30 min before the procedure. A control strain expressed the mitochondrial OM45-FKBPx4 anchor. Where indicated, a strain expressed OM45-FKBPx4 plus either Sec31-FRBx2 to anchor COPII or Sec21-FRBx2 to anchor COPI. The sec21-3 mutation was in the parental strain background. “Rap” indicates a 10-min treatment with 1 μg/mL rapamycin prior to the pulse. Numbers represent the molecular weight in kDa of marker proteins.

Figure 6—figure supplement 1. Thermosensitivity of the sec21-3 strain.

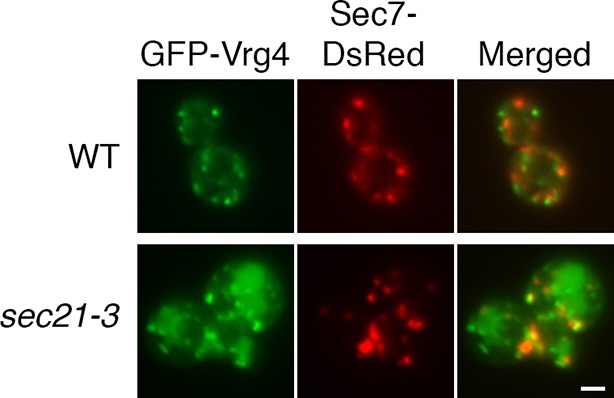
Figure 6—figure supplement 2. Perturbed Golgi structure in sec21-3 cells at the permissive temperature.

