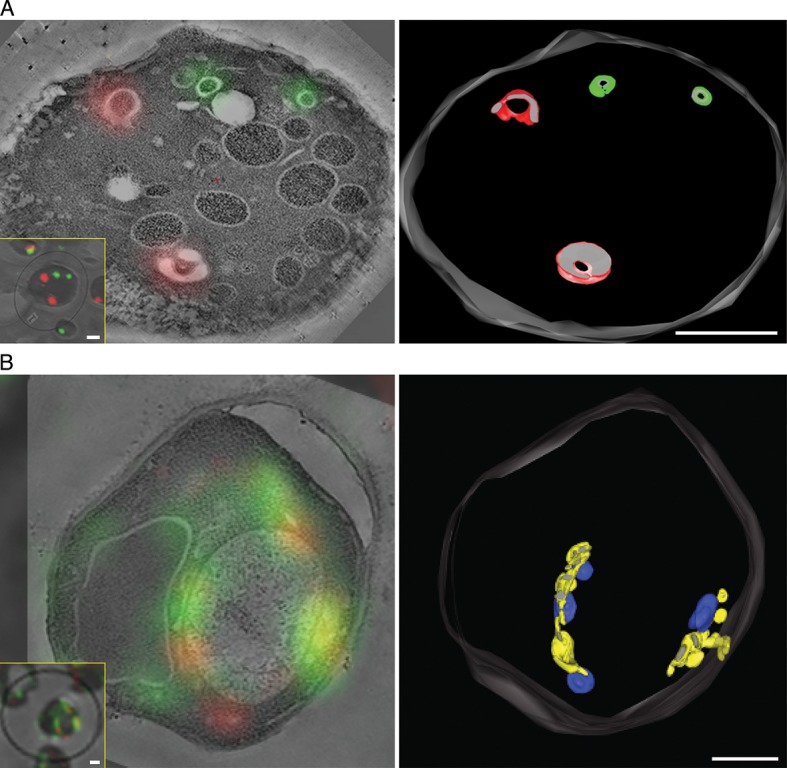
Figure 8. Correlative fluorescence microscopy and electron tomography of the yeast Golgi.

The yeast strain expressed GFP-Vrg4 and Sec7-DsRed, as well as OM45-FKBPx4 as a mitochondrial anchor plus Sec21-FRBx2 to anchor COPI. Cells were frozen, freeze substituted, and embedded in plastic in a manner that preserved fluorescence. Plastic sections were then examined by fluorescence microscopy followed by STEM tomography. The figures show either (A) a section ~0.5 μm thick from a representative untreated cell, or (B) a section ~1.0 μm thick from a representative cell after treatment for 10 min with 1 μg/mL rapamycin. In each case, the left panel shows the fluorescence signals overlaid on a projection of five 3- to 4-nm tomographic slices, the inset shows fluorescence and differential interference contrast analysis of the same cell, and the right panel shows a tomographic model of the relevant labeled structures. Full tomographic reconstructions for the untreated and rapamycin-treated cells are animated in Video 1 and Video 2, respectively. Green indicates early Golgi cisternae, red indicates late Golgi cisternae, yellow indicates hybrid Golgi structures, and blue indicates mitochondria. Scale bars, 1 μm.
