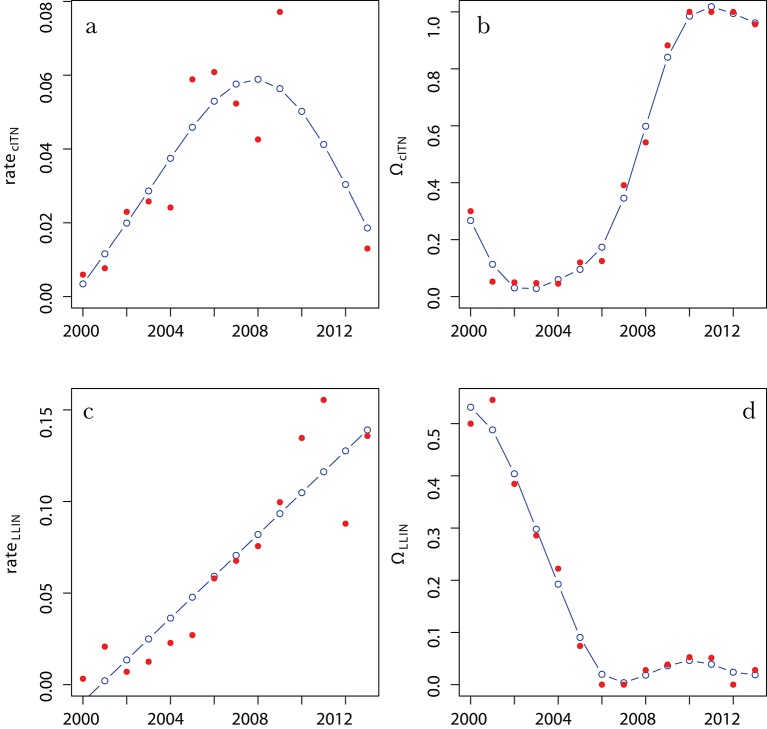
Appendix figure 3. Parameter fits for the hurdle exponential NMCP prior.
(A,C) are the exponential rate priors on the per capita rates of cITN (A) and LLIN (C) distributions in a given year (see Equations 10 and 11). (B,D) are the Bernoulli hurdle probabilities that zero cITNs (B) or LLINs (D) are distributed in a given year (see Equations 12 and 13). Red points are the data, and blue line are optimised spline fits. cITNs, conventional insecticide-treated nets; LLINs, long-lasting insecticidal nets; NMCP, National Malaria Control Programme.

