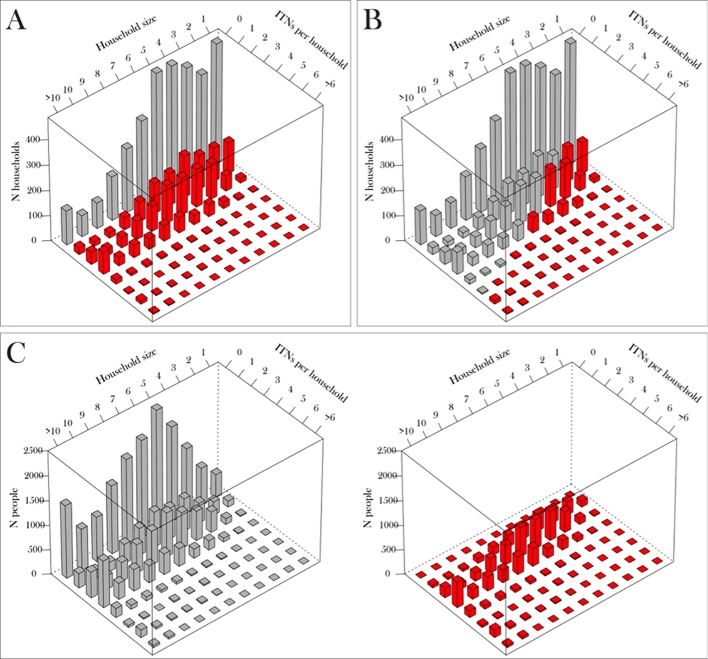
Appendix figure 6. Calculation of indicators 1–3 from two-dimensional histograms for Nigeria 2010 Malaria Indicator Survey.
(A) % HHs with one or more net, obtained by dividing the sum of red bars (HHs with one or more ITN) by the sum of all bars. (B) % HHs owning enough nets for one-between-two, obtained by dividing sum of red bars (i.e. those HHs meeting or exceeding the one-between-two criteria) by the sum of all bars. (C) % population with access to ITN in the HH, obtained by first converting bars to represent people rather than HHs, then dividing sum of individuals that would be able to access an ITN sharing with one other (red bars in right-hand histogram) with the sum of all individuals (grey bars in left-hand histogram). HHs, households; ITNs, insecticide-treated nets.

