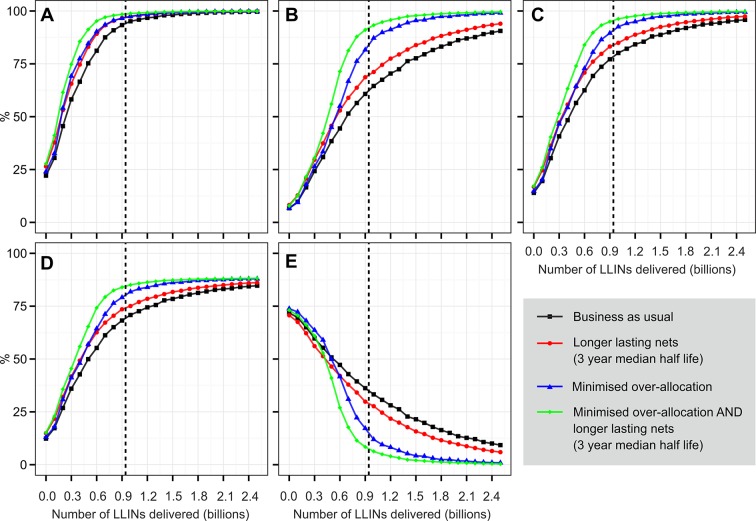
Figure 6. Projected 2017 coverage for sub-Saharan Africa in relation to number of LLINs delivered over 2014–2017 period.
(A) % households owning at least one ITN; (B) % households owning enough ITN for one between two; (C) % population with access to ITN within the household; (D) % population sleeping under an ITN the previous night; (E) 'ownership gap', the % of ITN-owning households with insufficient ITNs for one-between-two. For each indicator, we project likely coverage under four scenarios: current levels of over-allocation and net loss (i.e. 'business as usual'); with minimised over-allocation; with longer average net retention (3-yr median); and with both minimised over-allocation and longer net retention. The vertical dashed lines indicate the number of LLINs calculated as required over the period under the country programmatic needs assessment supported by Roll Back Malaria Harmonization Working Group. LLINs, long-lasting insecticidal nets; ITNs, insecticide-treated nets.

