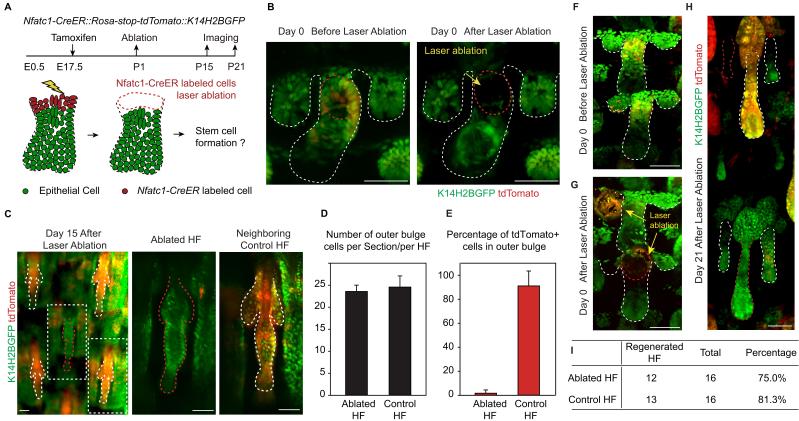
Figure 2. Niche position in the hair peg determines hair follicle stem cell fate.
(A) Diagram of two-photon-mediated cell ablation experiment using Nfatc1-CreER::Rosa-stop-tdTomator::K14H2BGFP mice. (B) Representative images of hair follicles before and after cell ablation in a live animal. (C) Representative whole-mount images of hair follicles 15 days after cell ablation. Notice that the control hair follicle has tdTomato+ cells in the bulge while the ablated hair follicle has a normal bulge composed of tdTomato- cells. (D) Quantification of hair follicle stem cell number at telogen using whole mount samples. N=6 mice, >12 HFs. (E) Quantification of percentage of tdTomato+ outer bulge cells at telogen using whole mount samples. N=6 mice, >12 HFs. (F–H) Representative images of hair follicles before (F), immediately after (G), and 21 days after (H) cell ablation from the same mouse. Notice that both the control hair follicle and ablated hair follicle enter anagen. (I) Quantification of hair follicles that have started regeneration 21 days post cell ablation. N=5. Scale bars: 50 μm


