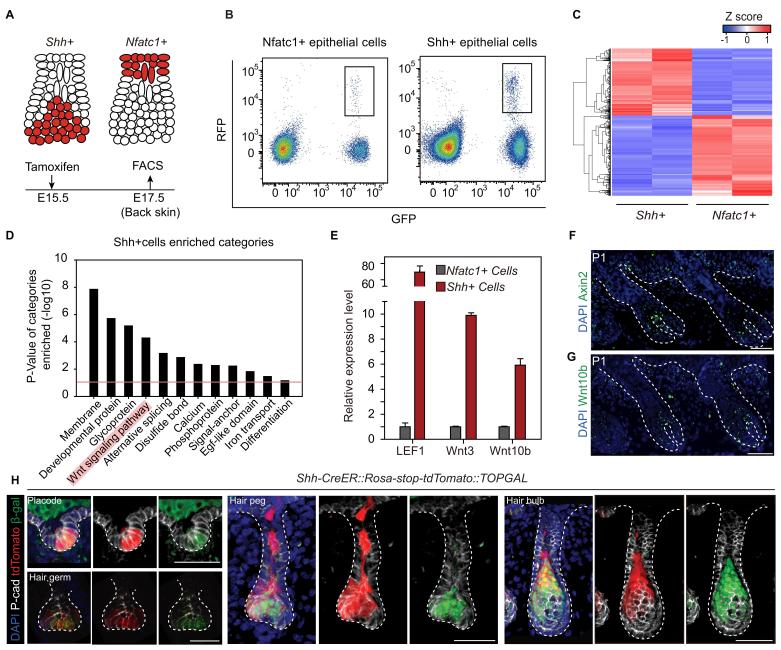
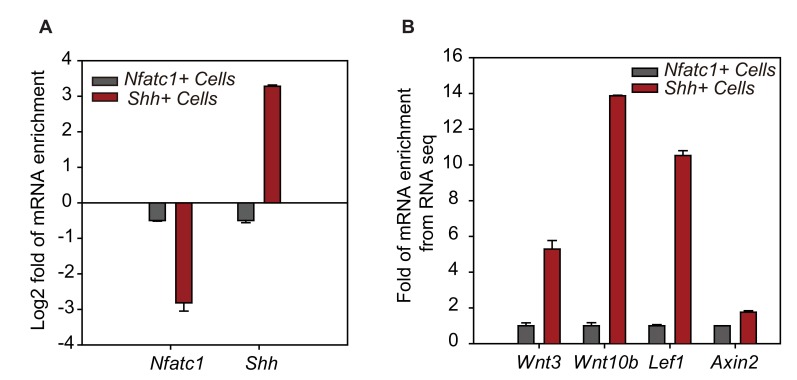
Figure 3. Unbiased RNA-seq analysis reveals factors that define the hair peg niche.
(A) Diagram of the FACS experiments using Nfatc1- and Shh-CreER::Rosa-stop tdTomato::K14H2BGFP mice. (B) FACS isolation of distinct GFP+RFP+ populations to obtain Shh+ and Nfatc1+ epithelial cells. (C) Unsupervised hierarchical clustering and heat map display of genes that were differentially expressed between Shh+ cells and Nfatc1+ cells. N=2 (D) Gene Ontology analysis of ≥2-fold up-regulated genes in Shh+ cells compared to Nfatc1+ cells. The Wnt signaling pathway is highlighted. (E) Validation of differentially expressed genes using qPCR. N=3. (F–G) In situ staining of Axin2 (F) and Wnt10b (G) in developing hair follicles. (H) Shh+ cells are Wnt/β-catenin signal responsive cells. Shh expression was represented by tdTomato in Shh-CreER::Rosa-stop-tdTomato mice. Wnt/β-catenin-responsive cells were detected by β-gal staining in TOPGAL mice. Scale bars: 50 μm.
DOI: http://dx.doi.org/10.7554/eLife.10567.008


