
Figure 2.
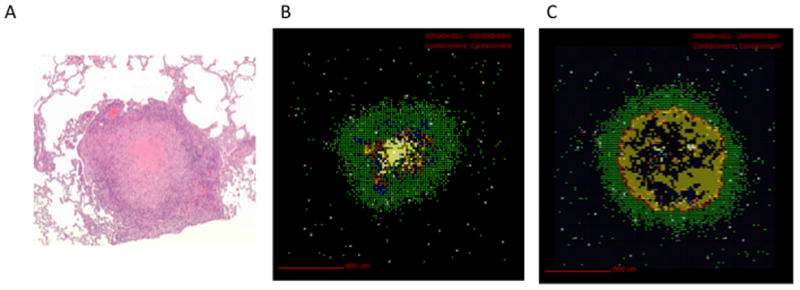
Experimental and virtual granulomas. (A) H&E stain of a NHP lung granuloma showing macrophages and lymphocytes surrounding a necrotic core (courtesy of Flynn Lab, University of Pittsburgh). (B) VE of a granuloma at day 200 post-infection, using a model similar to Ray et al. [8]. A well-circumscribed, stable granuloma that controls bacteria (but does not clear it) emerges. See also time courses at http://malthus.micro.med.umich.edu/lab/movies). Bacterial counts for this granuloma at day 200 are: 1309 intracellular Mtb, 825 extracellular Mtb, 302 nonreplicating Mtb in necrotic areas, and 2135 total Mtb. (C) VE representing a TNF knockout. Notice the much larger region of bacteria and significantly lower levels of activated macrophages. Bacterial counts for this granuloma at day 200 are: 3494 intracellular Mtb, 46601 Extracellular Mtb, 36 non-replicating Mtb in necrotic areas, and 50195 Total Mtb. For both (B) and (C) macrophages are shown as: resting (green), activated (blue), infected (orange), chronically infected (red). T cells are pink (CD4+) and purple (CD8+). Yellow shows bacterial concentrations and white hash marks represent necrotic regions.