
Figure 1.
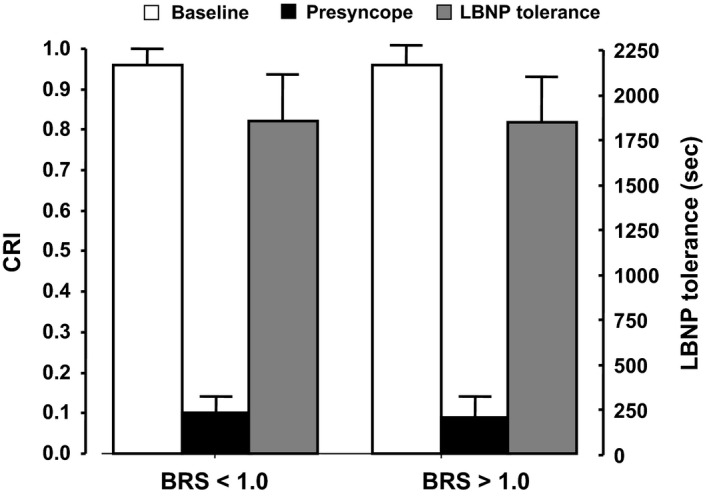
Lower body negative pressure (LBNP) tolerance (gray bars) and compensatory reserve index (CRI) at baseline (white bars) and at the time of presyncope (black bars). Values represent mean (bars) and 95% CI (“T” lines).
Official websites use .gov
A
.gov website belongs to an official
government organization in the United States.
Secure .gov websites use HTTPS
A lock (
) or https:// means you've safely
connected to the .gov website. Share sensitive
information only on official, secure websites.
Lower body negative pressure (LBNP) tolerance (gray bars) and compensatory reserve index (CRI) at baseline (white bars) and at the time of presyncope (black bars). Values represent mean (bars) and 95% CI (“T” lines).