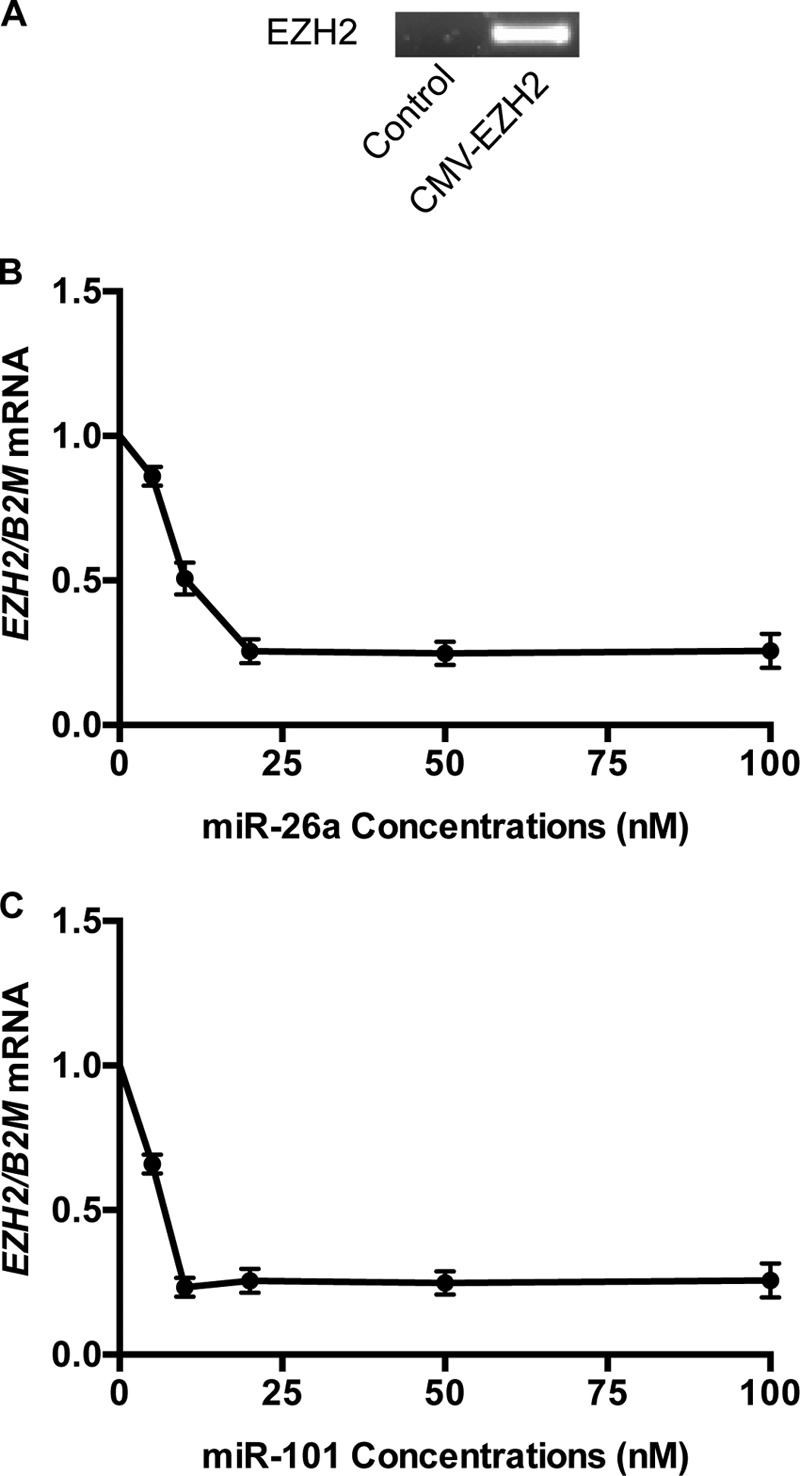
FIGURE 3.

Effect of different miRNA concentrations on exogenous EZH2. A, absence of endogenous EZH2 transcript in control human fibroblasts versus fibroblasts transfected with CMV-EZH2 expression plasmid. B, dose-response curve showing the effect of various concentrations of miR-26a on the expression of exogenous EZH2 mRNA. The minimal dose with the maximum effect is 25 nm (n = 4). C, dose-response curve showing the effect of various concentrations of miR-101 on the expression of exogenous EZH2. The minimal dose with the maximum effect is 20 nm (n = 4).
