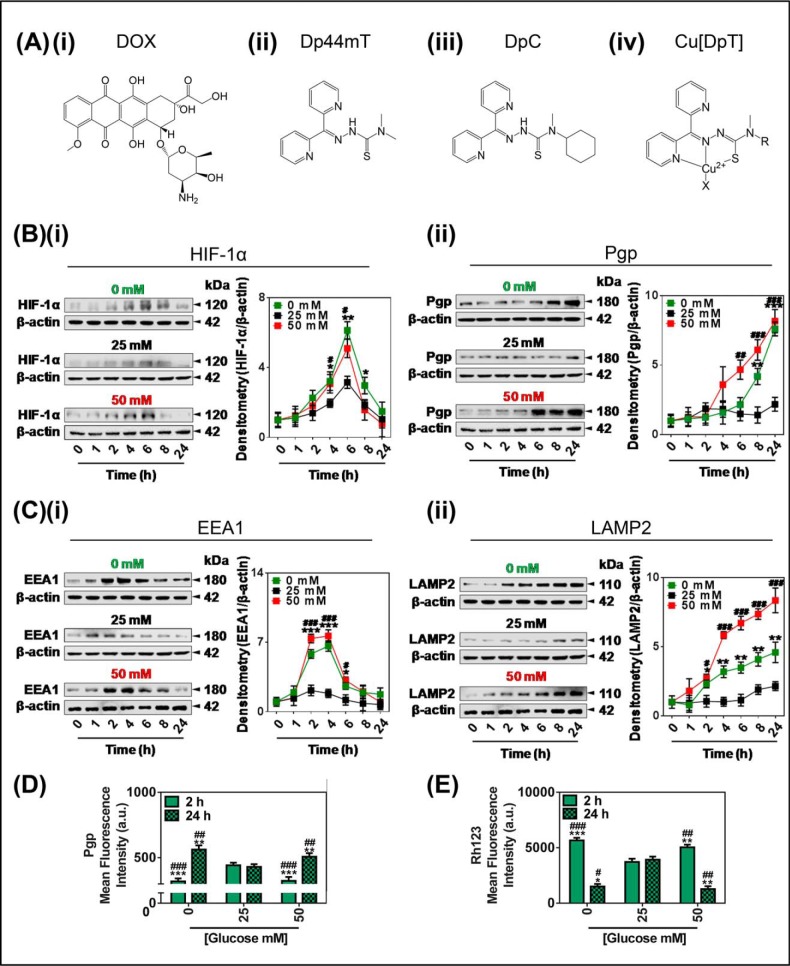
FIGURE 1.
Glucose variation-induced stress increased the protein expression of Pgp, HIF-1α, EEA1, and LAMP2. A, line drawings of the chemical structures of the agents used in the investigation: i, DOX; ii, Dp44mT; iii, DpC; iv, the generalized structure for a copper-bound dipyridylthiosemicarbazone (DpT); Cu[DpT]. B and C, KBV1 (+Pgp) cells incubated for 0–24 h at 37 °C of low (0 mm; green), control (25 mm; black), or high (50 mm; red) glucose have modulated protein levels of HIF-1α (i) and Pgp (ii) (B) and EEA1 (i) and LAMP2 (lysosome marker) (ii) (C). D and E, glucose variation-induced stress either decreases or increases surface Pgp and activity over a 2- or 24-h incubation, respectively. Flow cytometric analysis of plasma membrane-Pgp measured at 4 °C (D) and retention of the Pgp-substrate Rh123 (E) after a change from the control (25 mm) glucose levels to low (0 mm) or high (50 mm) glucose after 2 or 24 h at 37 °C incubation. The results in (B and C) are typical of three experiments; densitometry is the mean ± S.D. (n = 3). *, p < 0.05; **, p < 0.01; ***, p < 0.001 is 0 mm glucose-treated cells relative to the respective 25 mm glucose-treated cells at the same time point (e.g. 0 mm glucose versus 25 mm glucose at 1 h). #, p < 0.05; ##, p < 0.01; ###, p < 0.001 is 50 mm glucose-treated cells relative to the respective 25 mm glucose-treated cells at the same time point (e.g. 50 mm glucose versus 25 mm glucose at 1 h). The results in D and E are presented as arbitrary units (a.u.) and are the mean ± S.D. (n = 3). *, p < 0.05; **, p < 0.01, and ***, p < 0.001 are relative to 2 h control (25 mm) glucose. #, p < 0.05; ##, p < 0.01, and ###, p < 0.001 are relative to the 24-h glucose control (25 mm).

