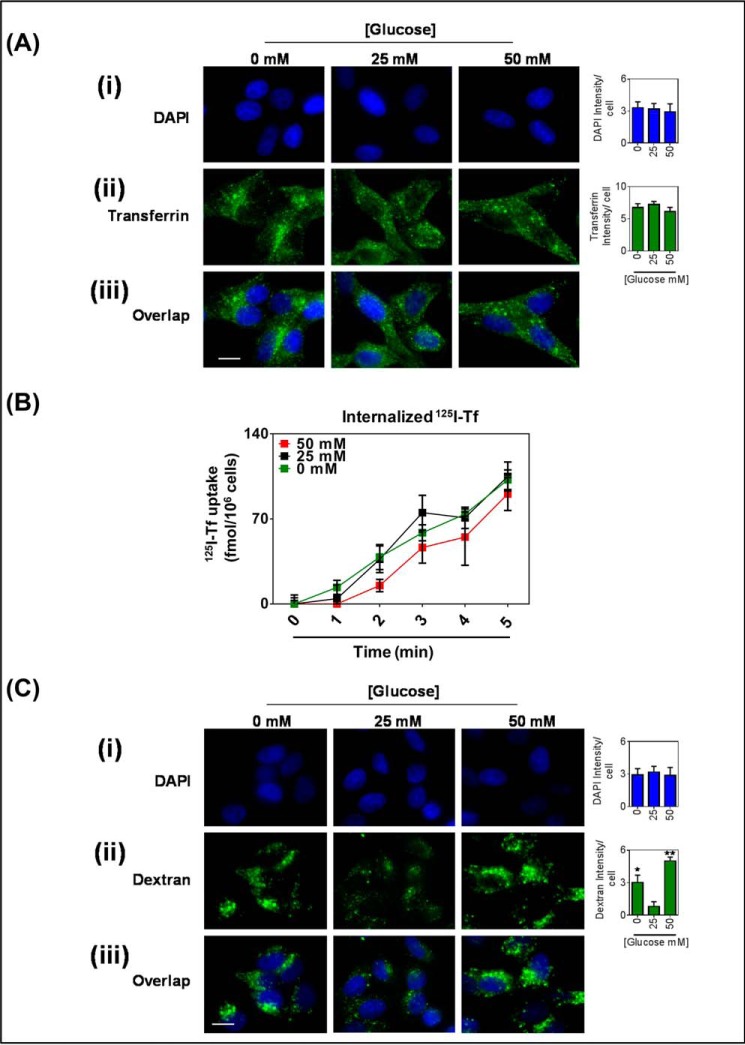
FIGURE 2.
Glucose variation-induced stress increased fluid-phase endocytosis of the plasma membrane. KBV1 (+Pgp) cells incubated with low (0 mm), normal (25 mm), or high (50 mm) glucose for 2 h at 37 °C. A, immunofluorescence microscopy images of cells co-incubated with transferrin (25 μm). i, DAPI (blue); ii, transferrin (green); iii, merged image. B, internalized human iodine-125 labeled transferrin over a 5-min time course. C, immunofluorescence microscopy images of cells co-incubated with Alexa Fluor 488®-dextran (10 μm). i, DAPI (blue); ii, dextran (green); iii, merged image. DAPI, transferrin, and dextran were quantified as fluorescence intensity/cell using ImageJ software. *, p < 0.05 and **, p < 0.01, are relative to 25 mm glucose treated cells. Scale bar = 10 μm.

