FIGURE 5.
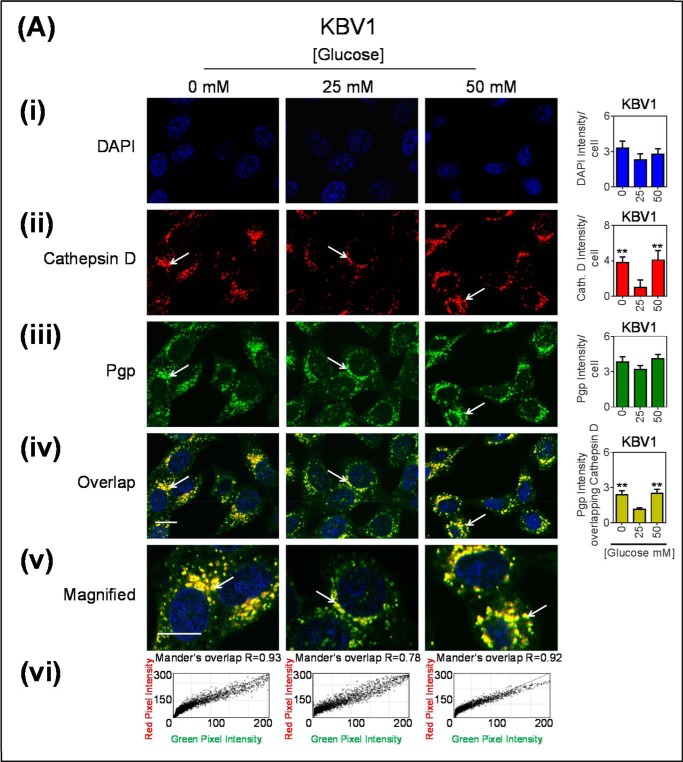
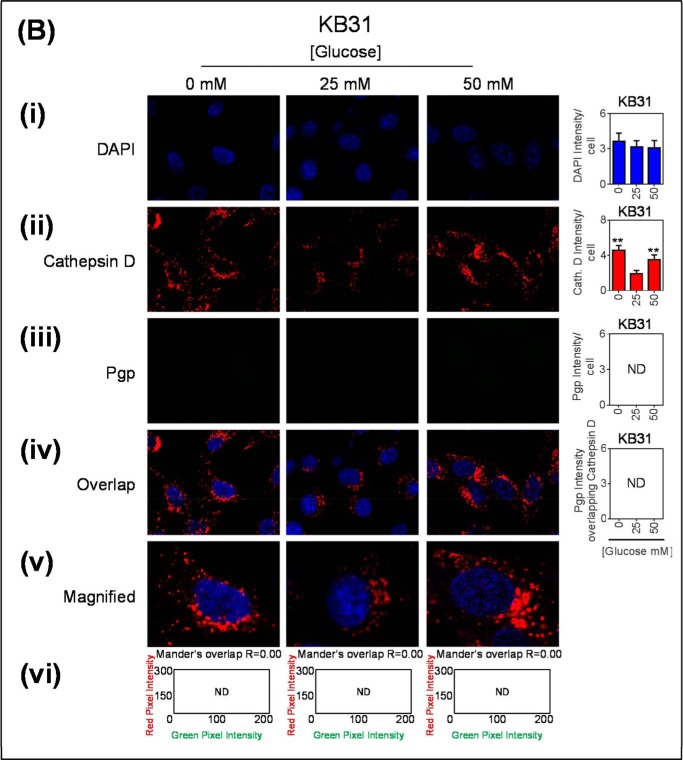
Glucose variation-induced stress increased the number of cathepsin D-stained lysosomes that are co-localized with Pgp. Confocal immunofluorescence microscopy images of KBV1 (+Pgp) (A) and KB31 (−Pgp) (B) cells incubated with low (0 mm), normal (25 mm), or high (50 mm) glucose for 2 h at 37 °C. Cells were stained for DAPI (blue) (i), cathepsin D (red) (ii), and Pgp (green) (iii). Shown is overlay image of all three stains (iv) and a magnified image of the overlap (v). The overlap between Pgp and cathepsin D is indicated by Mander's overlap co-efficient, R. DAPI, cathepsin D, and Pgp were quantified as fluorescence intensity/cell (vi). Pgp was also quantified as Pgp fluorescence intensity co-localizing with Cathepsin D using ImageJ software. **, p < 0.01 is relative to respective 25 mm treated control glucose (e.g. 0 mm glucose KBV1 versus 25 mm glucose KBV1). Arrows indicate the co-localization of cathepsin D with Pgp. Scale bar = 10 μm. ND stands for not detected.


