FIGURE 6.
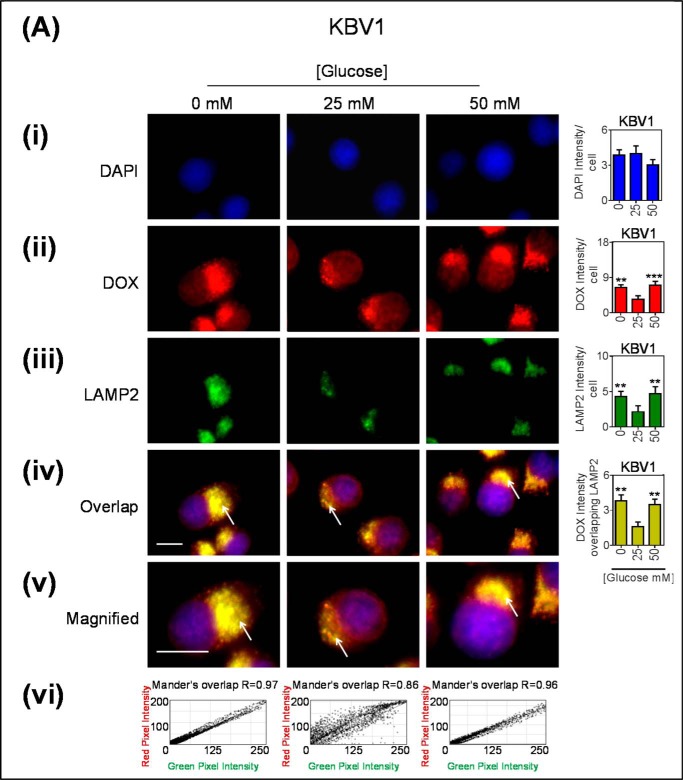
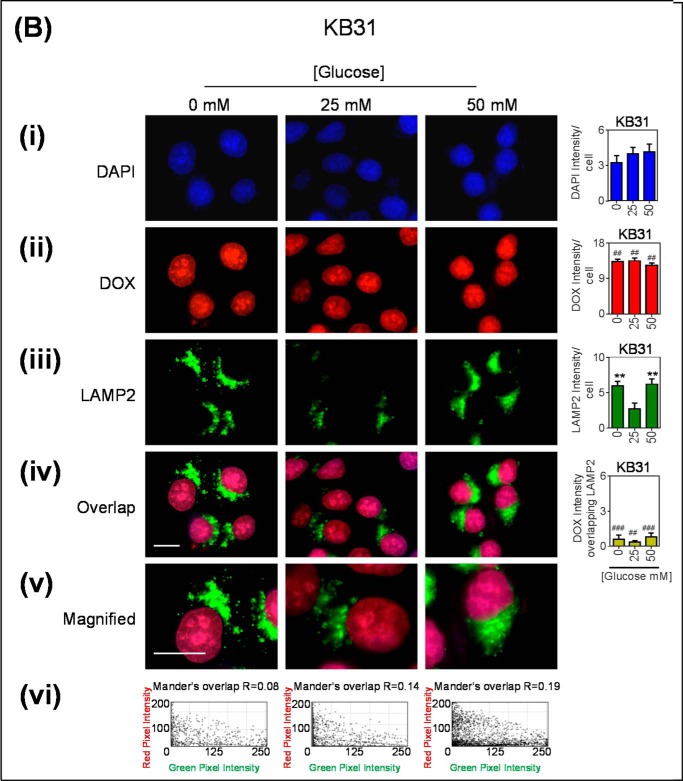
Glucose variation-induced stress increases DOX accumulation within lysosomes that possess functional Pgp. A, KBV1 (+Pgp) and (B) KB31 (−Pgp) cells were incubated for 2 h at 37 °C with low (0 mm), normal (25 mm), or high (50 mm) glucose before and during 40 min at 37 °C incubation with fluorescent DOX (100 μm). In all treatments cells were stained with DAPI (blue) (i), DOX (red) (ii), and LAMP2 (green) (iii). iv, the merge of all three stains (overlap); v, a magnified image of the overlap. The overlap between DOX and LAMP2 is indicated by Mander's overlap co-efficient, R. DAPI, DOX, and LAMP2 were quantified as fluorescence intensity/cell (vi). DOX was also quantified as intensity co-localizing with LAMP2 using ImageJ software. **, p < 0.01, and ***, p < 0.001 are relative to the respective 25 mm treated control glucose (e.g. 0 mm glucose KBV1 versus 25 mm glucose KBV1). ##, p < 0.01, and ###, p < 0.001 are relative to the respective glucose treatment (e.g. 0 mm glucose KBV1 versus 0 mm glucose KB31). The arrow indicates co-localization of DOX with LAMP2. Scale bar = 10 μm.


