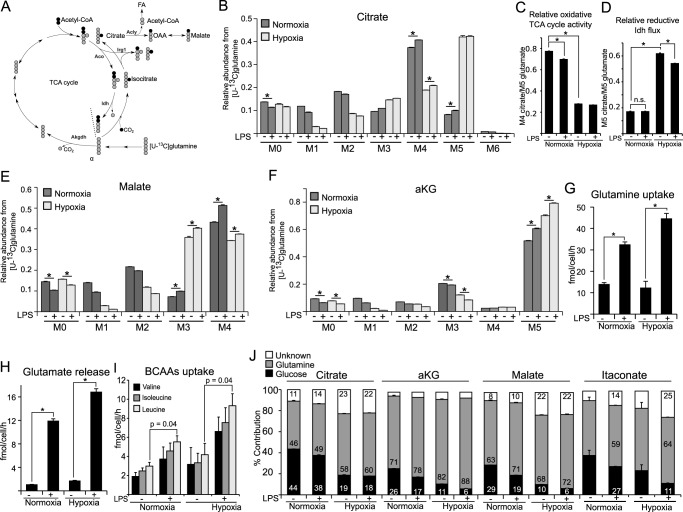
FIGURE 4.
Contribution of glutamine to central metabolism in M(LPS) macrophages. A, schematic of atom transitions in central metabolism using [U-13C]glutamine as a tracer. 13C-carbons are in gray, 12C in black. Citrate molecules derived from reductive carboxylation of αKG are M5 isotopologues, whereas citrate molecules from the oxidative route of the TCA cycle are M4 isotopologues. The dotted line indicates end of one route. Aco, aconitase; Idh, isocitrate dehydrogenase; Akgdh, αKG dehydrogenase; Acly, ATP-dependent citrate lyase; FA, fatty acid. B, MID of citrate. M0 to M6 indicates the different mass isotopologues. C and D, determination of oxidative TCA cycle activity: ratio of M4 citrate/M5 glutamate and ratio of M5 citrate/M5 glutamate indicating relative reductive Idh flux. E and F, MID of malate and αKG. G–I, absolute quantification of glutamine uptake, glutamate release, and uptake of the branched chain amino acids (valine, isoleucine, and leucine). J, carbon contribution (%) of glucose, glutamine, and other carbon sources to citrate, αKG, malate, and itaconate. Carbon contributions are based on MIDs from [U-13C]glucose labeling (Fig. 3) and [U-13C]glutamine labeling. Carbon contribution to itaconate under non-LPS conditions should not be considered because itaconate levels are negligibly low under these non-stimulated conditions (Fig. 1A). Error bars indicate S.E. (Welsh's t test, *, p < 0.01, n = 3). One representative experiment with three individual wells per condition is presented. Each experiment was performed at least three times.

