FIGURE 5.
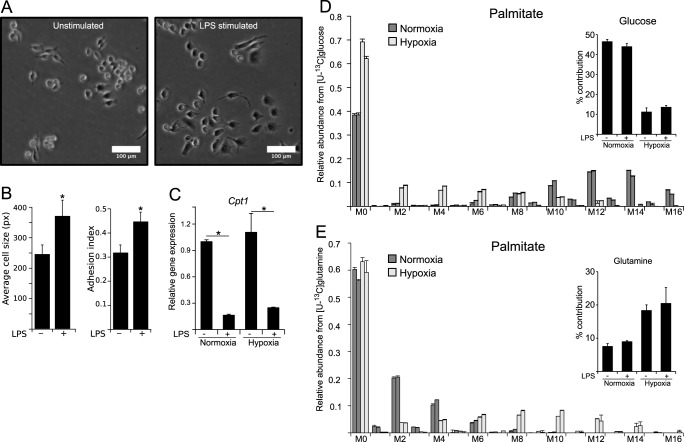
Morphological changes upon LPS activation require sustained lipogenesis in macrophages. A, microscopy (bright field image) of RAW macrophages unstimulated or stimulated with 10 ng/ml LPS for 6 h. White bar indicates 100 μm. B, mean average of cell size (pixels) (left) and analysis of adhesion index (right) of LPS-stimulated and -non-stimulated cells obtained from bright field microscopy. Analysis demonstrates morphological adaption of macrophages during LPS activation. For further details regarding the analysis approach, see under “Experimental Procedures.” C, relative gene expression of carnitine palmitoyl transferase1 (Cpt1) normalized to normoxia control (Ctrl) (−LPS), indicating inhibition of β-oxidation upon LPS stimulation. D and E, MID of palmitate using [U-13C]glucose (D) and [U-13C]glutamine (E) as a tracer. Contribution of each carbon source is depicted in the top right corner of each panel. Error bars indicate S.E. (Welsh's t test, *, p < 0.01, n ≥ 3). One representative experiment with three individual wells per condition is presented. Each experiment was performed at least three times, except for C. Presented is the mean ± S.E. over three independent experiments. (Welsh's t test, *, p < 0.01, n = 3).

