FIGURE 2.

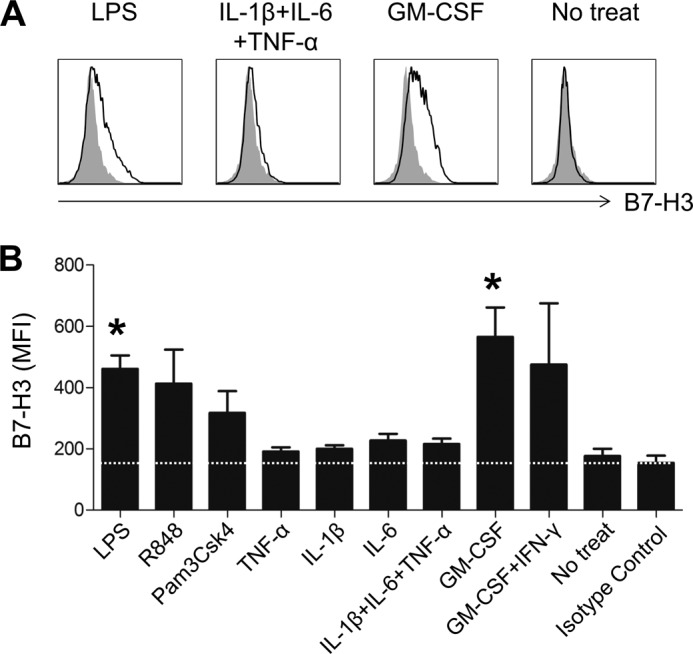
Expression of B7-H3 on monocytes is altered by treatment with TLR ligands and cytokines. PBMCs derived from healthy controls were stimulated for 18 h with the indicated TLR agonists or cytokines, and B7-H3 expression was analyzed by flow cytometry. A, representative flow cytometric analysis of the change in B7-H3 expression on CD14+HLA-DR+ cells after the indicated stimulations. B, bar graph showing the change in B7-H3 expression by monocytes treated with the indicated TLR agonists and proinflammatory cytokines (LPS (10 ng/ml), R848 (50 ng/ml), Pam3Csk4 (1 μg/ml), TNF-α (25 ng/ml), IL-6 (25 ng/ml), IL-1β (25 ng/ml), GM-CSF (60 ng/ml), and IFN-γ (25 ng/ml)) (n = 4). The mean fluorescence intensity (MFI) is indicated. Horizontal bars and error bars show the means ± S.E. *, p < 0.05 compared with the no treatment group by paired t test in B.
