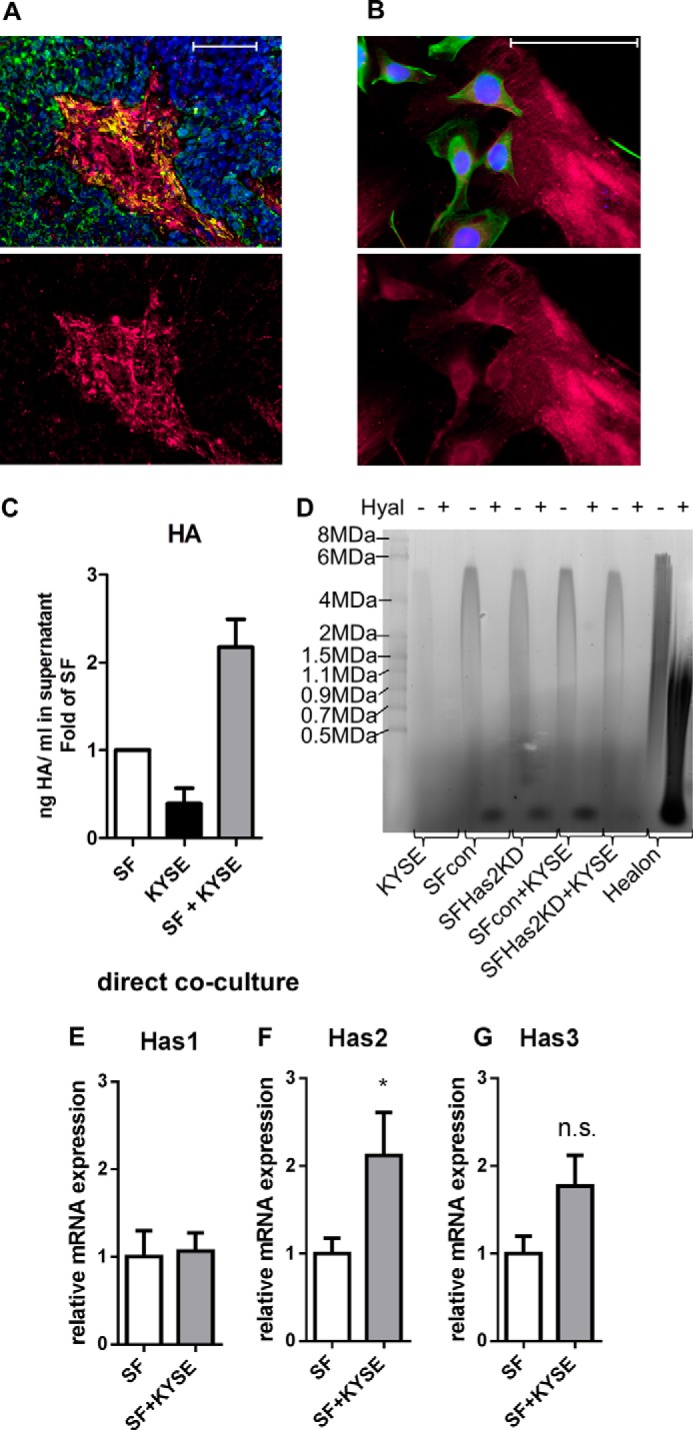
FIGURE 1.

Direct co-culture of KYSE-410 cells and fibroblasts resulted in an HA-rich environment. A, fluorescent staining of HA (magenta), αSMA (yellow), and CK-18 (green) in KYSE-410 xenograft tumors. Scale bar, 100 μm. Bottom, HA staining alone. B, fluorescent staining of HA (magenta) in cell culture. KYSE-410 cells are labeled in green (CK-18). Scale bar, 100 μm. Bottom, HA staining alone. C, HA secreted into the supernatant of monocultures and co-cultures of SF and KYSE-410 cells after 24 h determined by an ELISA-like assay; n = 4. D, representative HA-agarose gel of supernatants of mono- and co-cultures with KYSE-410 cells and SF with and without Has2 knockdown conditioned for 48 h. E–G, Has1, -2, and -3 mRNA expression in SF after 24 h of monoculture or direct co-culture with KYSE-410 cells (n = 7). Error bars, S.E. *, p < 0.05; n.s., not significant.
