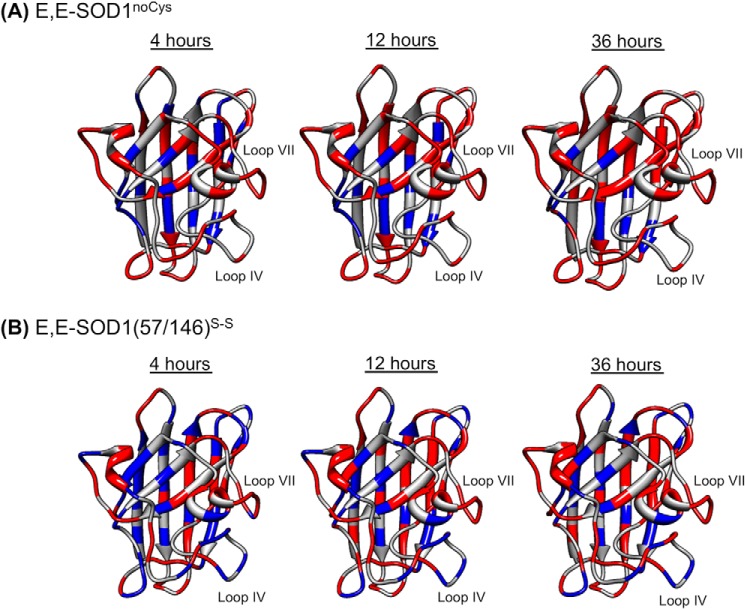
FIGURE 3.
A robust β-barrel structure of SOD1 with flexible loop regions. After dilution of the protein samples E,E-SOD1noCys (A) and E,E-SOD1(57/146)S-S (B) with a deuterated buffer, 1H,15N HSQC spectra were taken every 4 h, and the changes in the intensities of resonances from amide protons were analyzed. Relative intensities of resonances at 4, 12, and 36 h after dilution were calculated using those before H/D exchange as a reference. Amino acid residues in the structure of SOD1 protomer are colored based upon the relative intensities (red, <0.2; blue, >0.2).

