FIGURE 4.
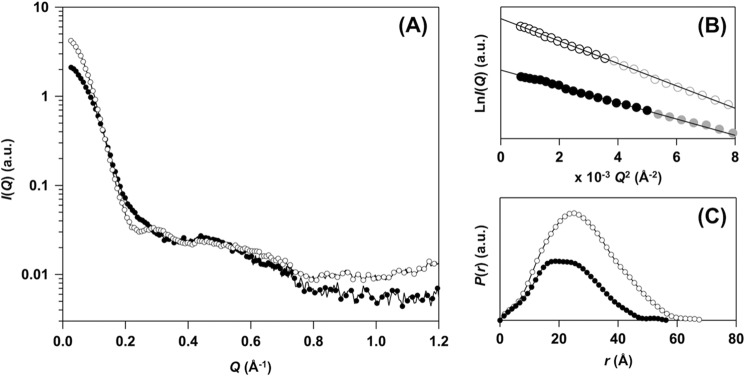
SAXS experiments support distinct conformations between E,E-SOD1noCys and E,E-SOD1(57/146)S-S. A, SAXS curves of E,E-SOD1noCys (filled circles) and E,E-SOD1(57/146)S-S (open circles). Scattering intensity, I(Q), is plotted against scattering angular momentum, Q, in a logarithmic scale. The indicated curves were obtained by merging the two curves taken with different camera lengths, one at infinite dilution (0.02592 Å−1 < Q < 0.70975 Å−1) and the other at finite concentration (0.06994 Å−1 < Q < 1.48845 Å−1). B, Guinier plots of the scattering curves obtained in E,E-SOD1noCys (filled circles) and E,E-SOD1(57/146)S-S (open circles) at infinite dilution. Each line shows the linear fit to ln I(Q) using the Q range from 0.02588 to Qmax < 1.3/Rg (black data points), which gave the estimated values of Rg and I(0) (Table 1). C, the pair-distance distribution function, P(r), from the scattering profile is shown: E,E-SOD1noCys (filled circles) and E,E-SOD1(57/146)S-S (open circles). Dmax values obtained from P(r) are summarized in Table 1.

