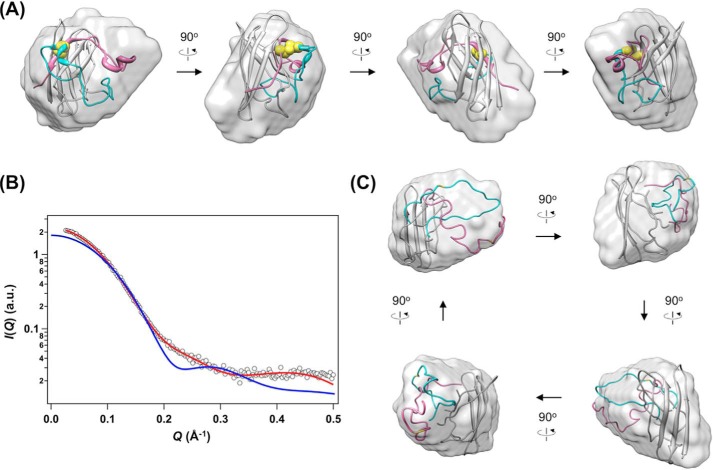
FIGURE 5.
Significant disorder of loops IV and VII describes a distinct conformation of the most immature SOD1. A, an overall shape of E,E-SOD1noCys (surface model) that was restored from the scattering curve is visualized using the SITUS package, onto which a monomer unit of the SOD1 crystal structure (ribbon model) is superimposed (normalized spatial discrepancy = 0.9203). Cys-57 and -146, which are involved in the formation of an intramolecular disulfide bond, are shown in yellow. Regions allowed for conformational changes during refinements are colored in cyan (loop IV) and pink (from loop VII to the C terminus). B, an experimentally observed scattering curve of E,E-SOD1noCys (open circles) is compared with the one calculated from a monomer unit of the SOD1 crystal structure (blue, χ = 7.29). A theoretical curve of the most representative model of E,E-SOD1noCys with peeled loops IV and VII is shown in red (χ = 1.98), which is superimposed in panel C onto the low resolution envelope of E,E-SOD1noCys (normalized spatial discrepancy = 0.8867). The details and statistics of the modeling are summarized in Table 2.

