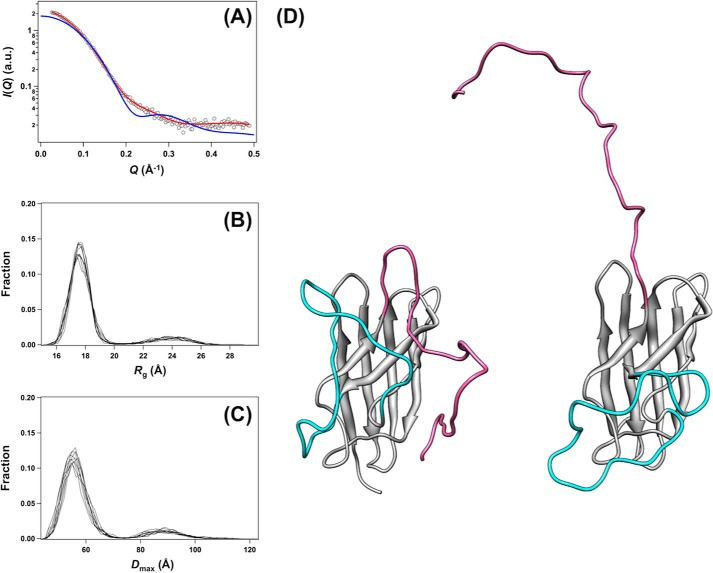
FIGURE 6.
An experimental SAXS curve of E,E-SOD1noCys was reasonably fit with an ensemble of conformations. From 10,000 hypothetical rigid-body models with the randomly flexed loops IV and VII, 10 independent ensembles of conformations were reconstructed to fit the experimental SAXS curve of E,E-SOD1noCys (Fig. 4A). A, a theoretical curve obtained from a representative ensemble of conformations with the flexed loops IV and VII is shown in red and well matched with the observed scattering curve (open squares, χ = 1.14). A scattering curve calculated from a monomer unit of the SOD1 crystal structure is again shown for comparison (blue, χ = 7.29). A distribution of Rg (B) and Dmax of conformations (C) in each of those 10 ensembles is shown. D, representative conformations in a population with (left) 17.9 Å and (right) 24.2 Å of Rg are shown. Regions allowed for conformational changes during refinements are colored cyan (loop IV) and pink (from loop VII to the C terminus).

