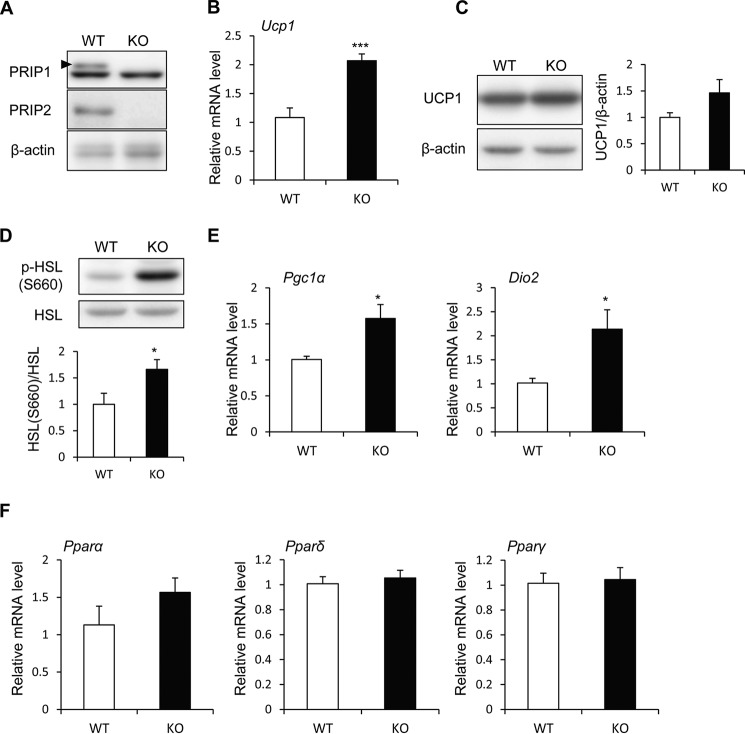
FIGURE 4.
Enhanced expression of UCP1 mRNA and protein and elevated lipolysis in Prip-KO mouse BAT. RD-fed 10-week-old wild-type (WT) and Prip-KO (KO) mice kept at 30 °C for 24 h were used for these experiments. A, expression of PRIP1 and PRIP2 in BAT. Arrowhead shows the specific PRIP1 band. B, Ucp1 mRNA expression in BAT was analyzed by qRT-PCR (WT and KO, n = 6). C and D, UCP1 protein expression (C) and HSL phosphorylation (p-HSL S660) (D) in BAT were analyzed by immunoblotting (WT and KO, n = 6). β-Actin (C) and HSL (D) were used as the loading controls. Bands were quantified using ImageJ software. Mean values normalized to the loading control are shown. Representative images from 6 independent experiments are shown. E and F, Pgc1α, Dio2, Pparα, Pparδ, and Pparγ mRNA expression in BAT was analyzed by qRT-PCR (30 °C, WT and KO, n = 6). The WT value is set to 1. The data represent the mean ± S.E. *, p < 0.05; ***, p < 0.001 versus the corresponding WT value.

