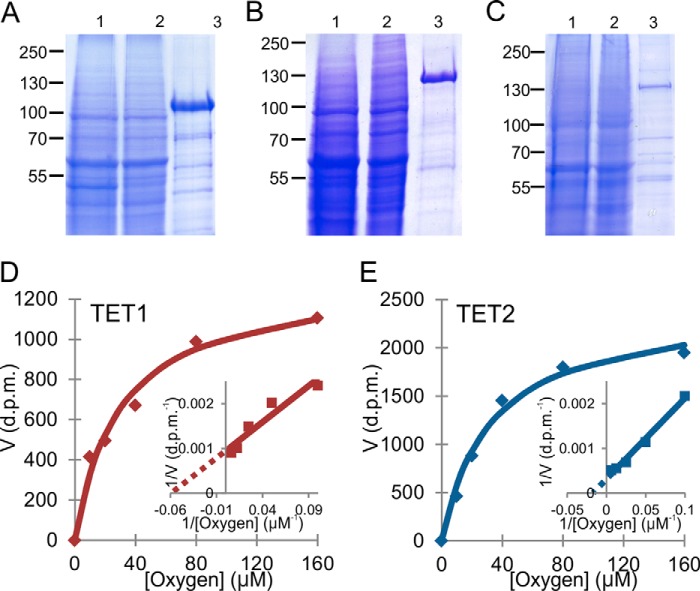
FIGURE 1.
Expression, affinity purification, and kinetic analyses of Tets. A–C, SDS-PAGE and Coomassie Blue analysis of the expression and affinity purification of recombinant Tet1 (A), Tet2 (B), and Tet3 (C). Cell lysate (lane 1), unbound proteins (lane 2), and FLAG-affinity purified proteins (lane 3) are shown. D and E, Michaelis-Menten curves and Lineweaver-Burk plots (inset) of Tet1 and Tet2 for oxygen.

