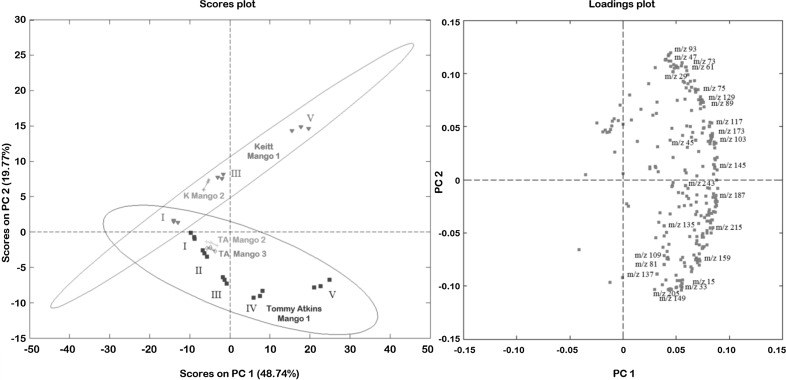
Fig. 2.
Principle component analysis of the mango ripening experiment (ellipses represent a 95 % confidence interval). Tommy Atkins Mango 1 = batch experiment, TA Mangos 2 and 3 represent single stage II mangos analyzed under dry nitrogen and VOC scrubbed air, respectively. Keitt Mango 1 = batch experiment, K Mango 2 represents the single stage II Keitt Mango experiment

