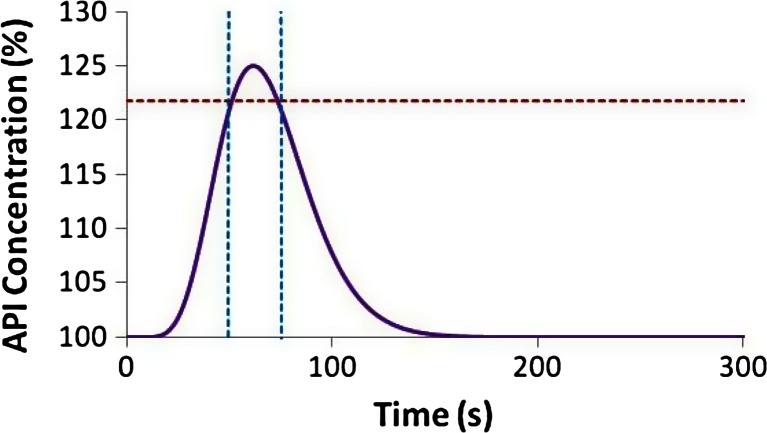
Fig. 20.
Concentration profile for a pulse response resulting in a peak of 125 % concentration. The red horizontal dotted line indicates a 121.75 % limit and the two vertical blue dotted lines indicate the width of the standard deviation (22.4 s) of the corresponding RTD, which is shown in Fig. 17

