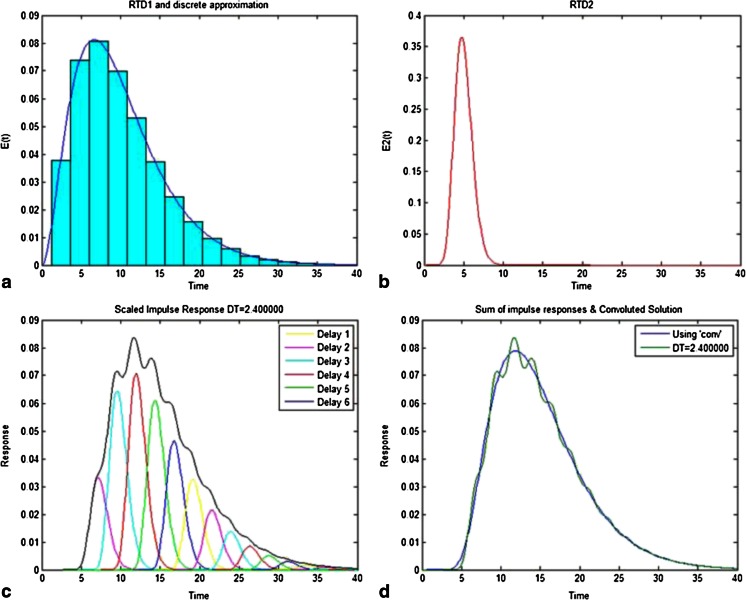
Fig. 4.
Visual representation of the convolution technique for two residence time distributions (RTDs), E1 and E2. a Discrete approximation of E1. b E2. c E1’s discrete approximation-scaled responses of E2 and their sum. d Sum of impulse responses for a time interval of 2.4 s and result from convolution function

