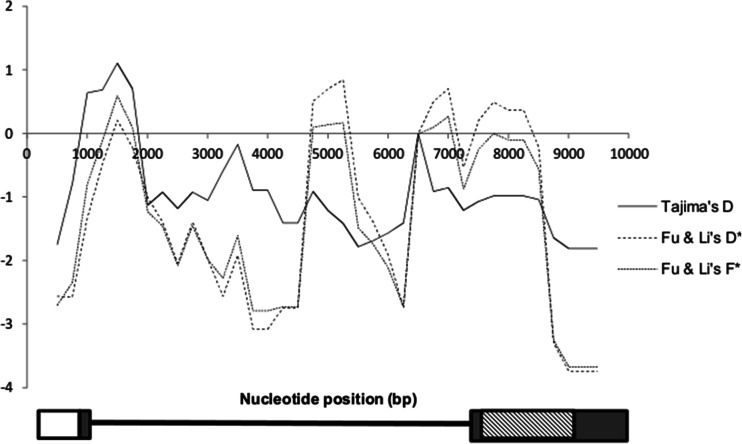
Fig. 1.
Sliding window plots for TLR2 gene. Sliding window plots of Tajima’s D, Fu and Li’s F*, and Fu and Li’s D* tests within the European (wild boars and domestic pigs combined) porcine population using window length of 1000 bp and step size of 250 bp. The white box represents the five upstream regions, the thick black line represent the intronic region, the grey boxes show the exonic regions and the ectodomain is represented by the box with light down diagonal lines. The distal part of the ectodomain show significant values for neutrality indices

