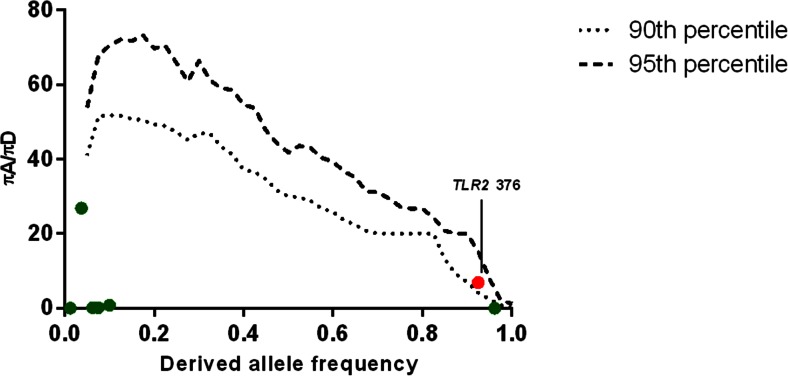
Fig. 2.
Positive selection for TLR2. Detection of positive selection in European (wild boars and domestic pigs combined) porcine population TLR2 ectodomain using the DIND test. The short and long dashed lines represent the 90th and 95th percentiles of the empirical distribution of expected πA/πD values obtained from 10,000 simulations of the ectodomain conditional on the number of segregating sites and the recombination rate of the ectodomain and integrating the wild boar demographic model previously described (Groenen et al. 2012). Green dots represent TLR2 SNPs under neutrality and red dot represents TLR2 SNPs under positive selection

