
FIGURE 4.
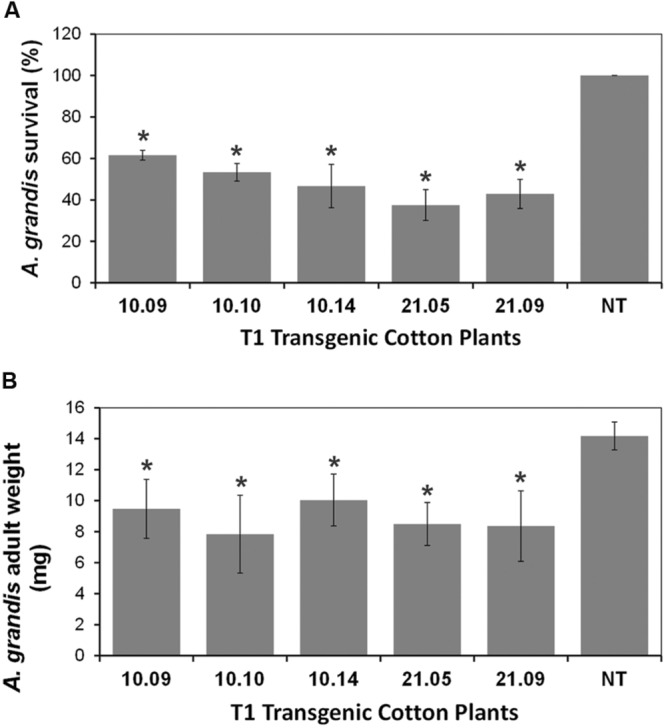
Bioassays of Transgenic Cotton Plants with Anthonomus grandis. This analysis was performed on the T1 transgenic plants with the non-transgenic plants acting as controls. (A) The survival of A. grandis. (B) The adults weight. Bioassays were conducted inoculating A. grandis eggs into a 6 mm cotton flower bud and survival rate was determined on the 20th day after inoculation. Legend: The numbers 10.09, 10.10, 10.14, 21.05, and 21.09 in the four panels are the identifiers of T1 GM cotton plants (10 and 21 progeny), as well as NT is the non-transformed plant. The asterisks (∗) highlight the samples with significant statistical difference (ANOVA, p ≤ 0.05) using the NT cotton plant as the reference.