
Figure 3.
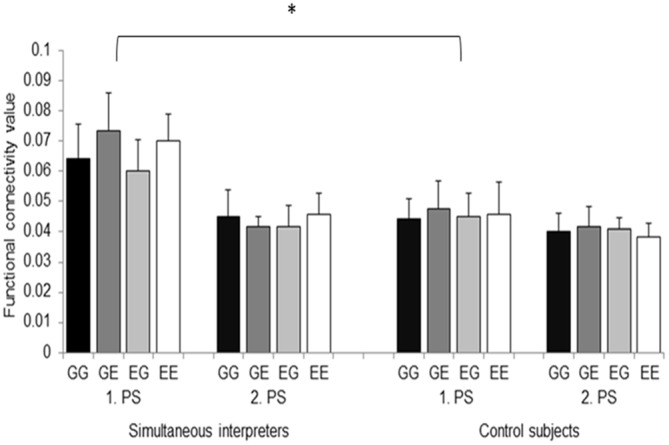
Functional connectivity values between the left ARC and Broca’s region are depicted separately for the 2 groups, the 2 processing stages (i.e., 1. PS and 2. PS), and the 4 language directions. GG, German-German; GE, German-English; EG, English-German; EE, English-English. Error bars indicate standard error. *p < 0.05.