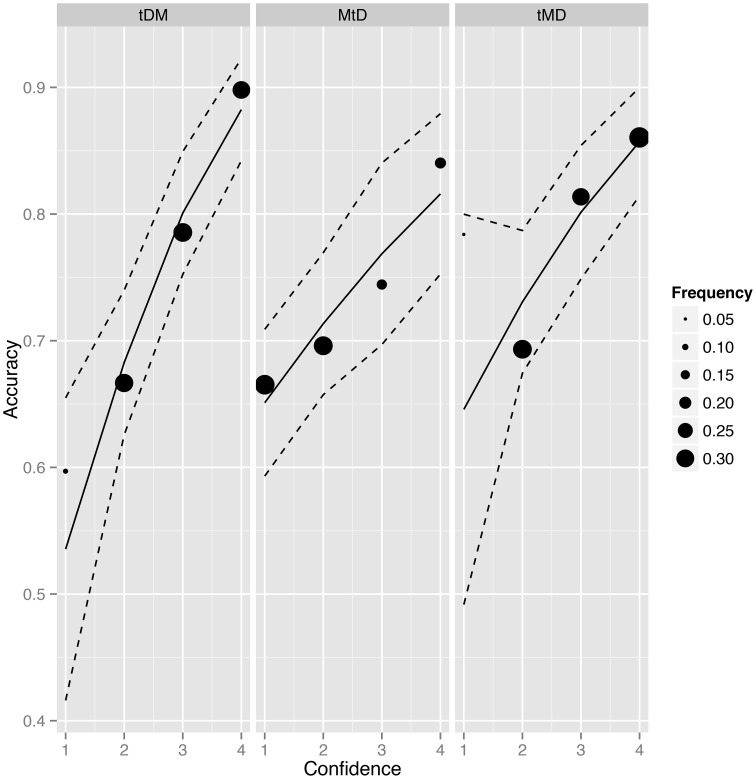
Figure 2.
Average accuracy, scale response frequency and model fit for the relationship between accuracy and confidence ratings in each condition (tDM, target-decision-metacognition; MtD, metacognition-target-decision; tMD, target-metacognition-decision). The position of filled circles represents average accuracy for each scale point. The frequency describes the proportion of each confidence rating response in each condition. Dashed lines represent 95% confidence intervals.

