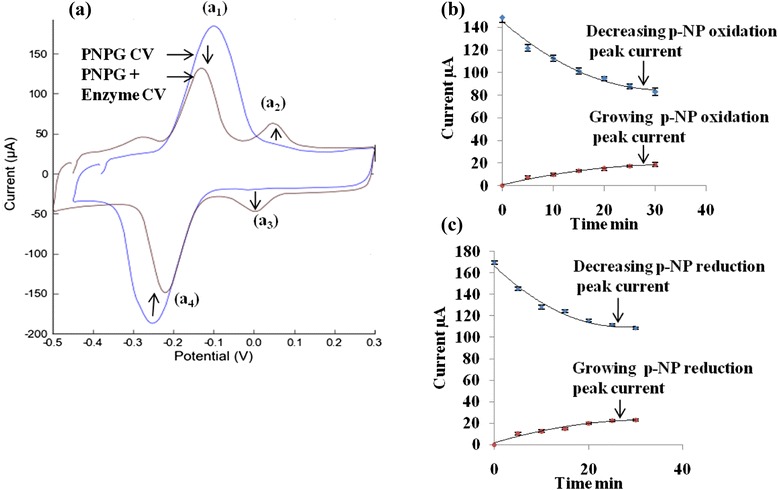
Fig. 5.

a Cyclic voltammograms of PNPG (red) and PNPG + enzyme (blue) after 20 min in presence of 0.1 M phosphate buffer at pH 6.8 on the SP-CNT electrode, (a 1) decreasing attached p-NP oxidation peak, (a 2) growing released p-NP oxidation peak, (a 3) growing released p-NP reduction peak, (a 4) decreasing attached p-NP reduction peak; b decreasing and growing oxidation peak currents of the attached and the released p-NP; and c decreasing and growing reduction peak currents of the attached and the released p-NP
