Fig. 2.

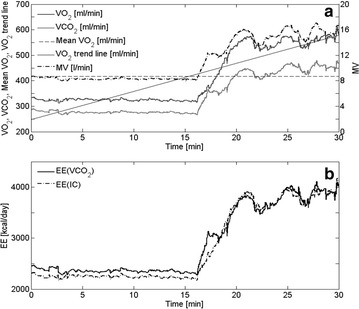
a Recorded VO2, VCO2 and MV from Patient 18. The mean and trend line of VO2 are also displayed. b EE(VCO2) and EE(IC) were calculated from recorded VO2 and VCO2

a Recorded VO2, VCO2 and MV from Patient 18. The mean and trend line of VO2 are also displayed. b EE(VCO2) and EE(IC) were calculated from recorded VO2 and VCO2