Fig. 1.

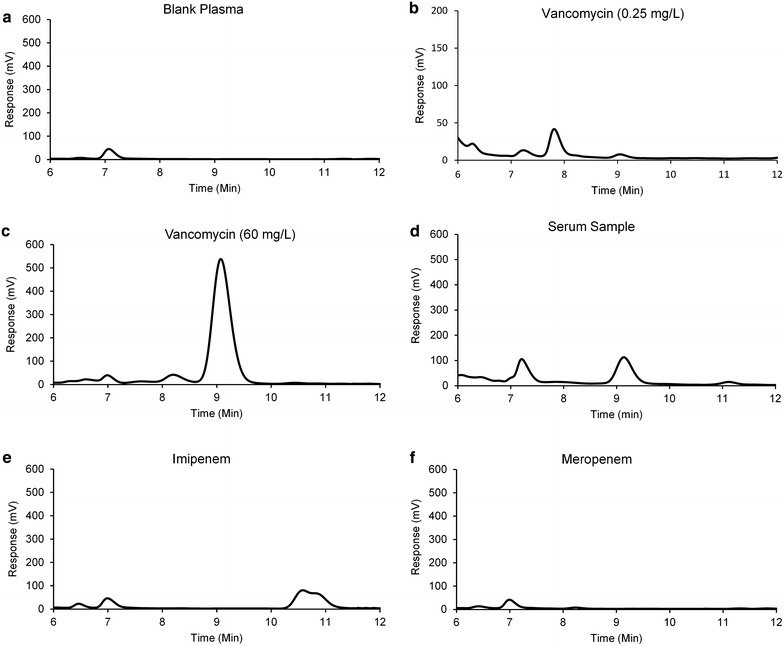
Chromatograms of blank plasma (a), plasma spiked with vancomycin 0.25 mg/L (b) and 60 mg/L (c), a patient’s sample 14.2 mg/L (d), plasma spiked with imipenem 60 mg/L (e) and plasma spiked with meropenem 60 mg/L (f)

Chromatograms of blank plasma (a), plasma spiked with vancomycin 0.25 mg/L (b) and 60 mg/L (c), a patient’s sample 14.2 mg/L (d), plasma spiked with imipenem 60 mg/L (e) and plasma spiked with meropenem 60 mg/L (f)