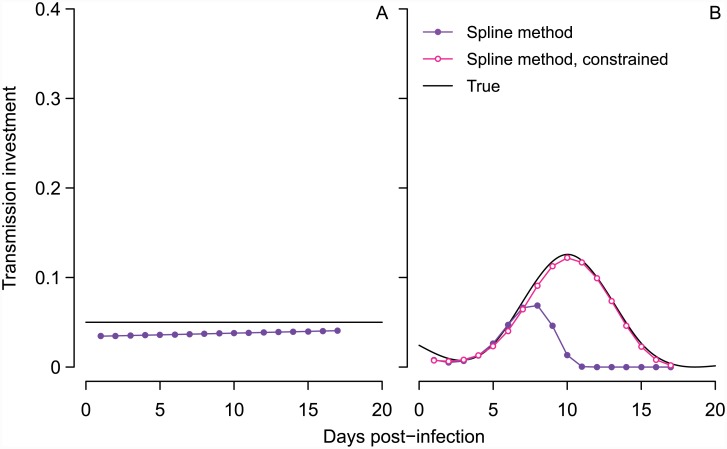
Fig 3. The spline method performs better than previous methods in capturing the true pattern of transmission investment.
The true pattern is shown in black for constant (A) and variable (B) investment, while the spline estimate is indicated with closed purple circles for comparison to previous methods in Fig 2A and 2B. The gametocyte carryover (ϵ) corresponding to those estimated splines was 28% in (A), and 42% in (B), where the true value was 30%. In (B), constraining the gametocyte carryover to be less than 35% improved the spline fit (open pink circles), an improvement that is not possible for previous methods which do not account for carryover.

