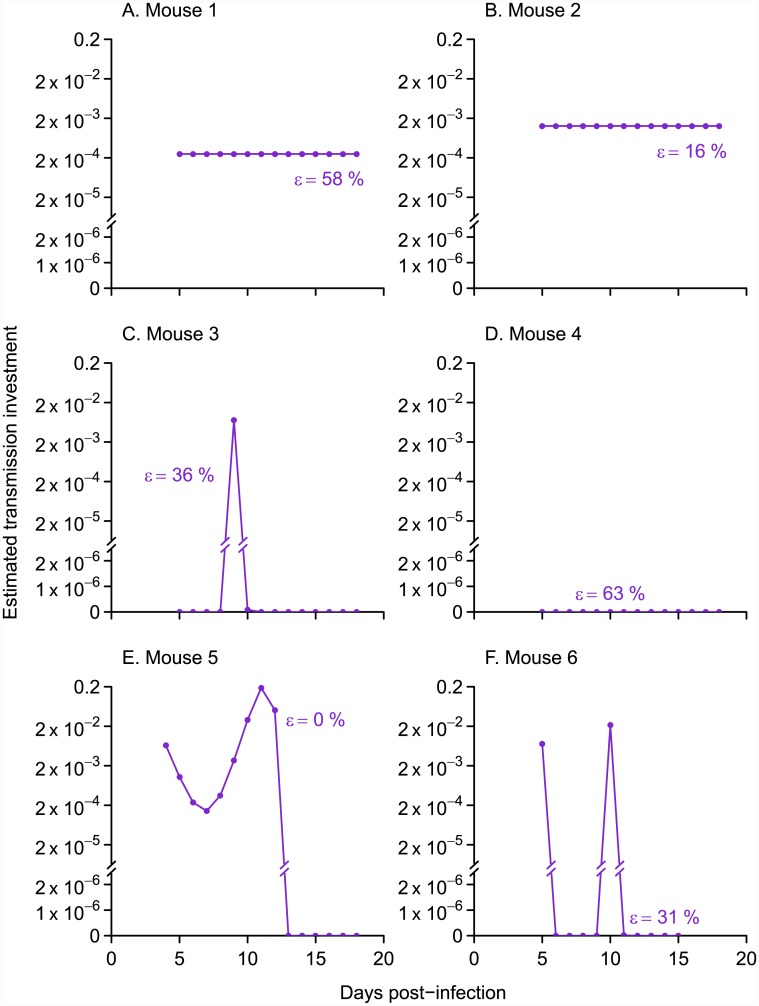
Fig 4. The spline method shows evidence for both constant and variable patterns of transmission investment in data from six mice.
Points indicate the pattern of transmission investment associated with the best fit to logged gametocyte counts (S5 Fig). When the proportion gametocyte carryover (ϵ) was allowed to vary between zero and one (purple closed dots), three mice showed constant levels of transmission investment (A, B, and D) while the others showed variable patterns (C, E, and F). The corresponding levels of gametocyte carryover are given next to each curve, and all fall below the upper confidence limit reported previously (67%, equivalent to a 41-hour half life, [20]). The observed and predicted gametocyte counts are shown in S5 Fig.

